Jiangji
RSP 10653
Grower: CSU
General Information
- Sample Name
- Jiangji 5
- Accession Date
- February 14, 2017
- Reported Plant Sex
- Female
- Report Type
- StrainSEEK v2 3.2Mb
- DNA Extracted From
- Leaf
The strain rarity visualization shows how distant the strain is from the other cultivars in the Kannapedia database. The y-axis represents genetic distance, getting farther as you go up. The width of the visualization at any position along the y-axis shows how many strains there are in the database at that genetic distance. So, a common strain will have a more bottom-heavy shape, while uncommon and rare cultivars will have a visualization that is generally shifted towards the top.
Chemical Information
Cannabinoid and terpenoid information provided by the grower.
Cannabinoids
No information provided.
Terpenoids
No information provided.
Genetic Information
- Plant Type
- Type I
File Downloads
The bell curve in the heterozygosity visualization shows the distribution of heterozygosity levels for cannabis cultivars in the Kannapedia database. The green line shows where this particular strain fits within the distribution. Heterozygosity is associated with heterosis (aka hybrid vigor) but also leads to the production of more variable offspring. When plants have two genetically different parents, heterozygosity levels will be higher than if it has been inbred or backcrossed repeatedly.
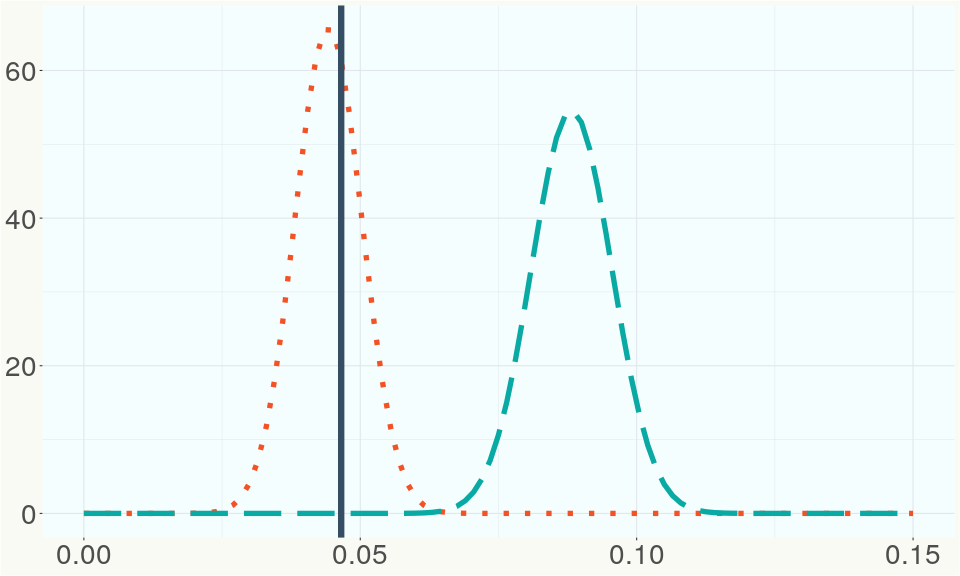
The ratio of reads mapped to Y-contigs to reads mapped to the whole Cannabis genome (Y-ratios) has been demonstrated to be strongly correlated with plant sex typing. This plot shows the distribution of Y-ratios for all samples in our database which were sequenced with the same method (panel or WGS) as this sample and where this sample falls in the distribution.
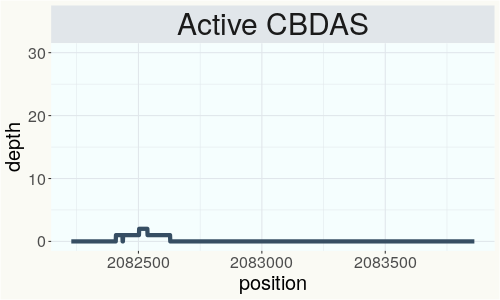
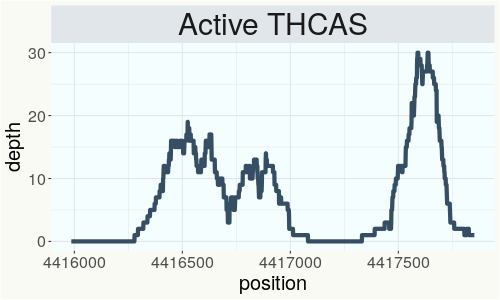
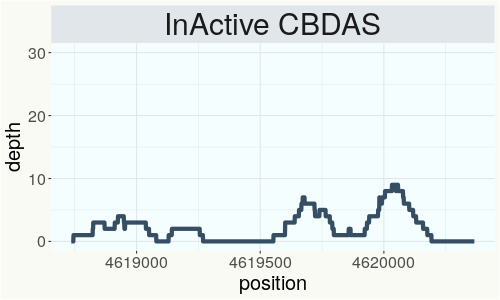
This chart represents the Illumina sequence coverage over the Bt/Bd allele. These are the three regions in the cannabis genome that impact THCA, CBDA, CBGA production. Coverage over the Active CBDAS gene is highly correlated with Type II and Type III plants as described by Etienne de Meijer. Coverage over the THCA gene is highly correlated with Type I and Type II plants but is anti-correlated with Type III plants. Type I plants require coverage over the inactive CBDA loci and no coverage over the Active CBDA gene. Lack of coverage over the Active CBDA and Active THCA allele are presumed to be Type IV plants (CBGA dominant). While deletions of entire THCAS and CBDAS genes are the most common Bt:Bd alleles observed, it is possible to have plants with these genes where functional expression of the enzyme is disrupted by deactivating point mutations (Kojoma et al. 2006).
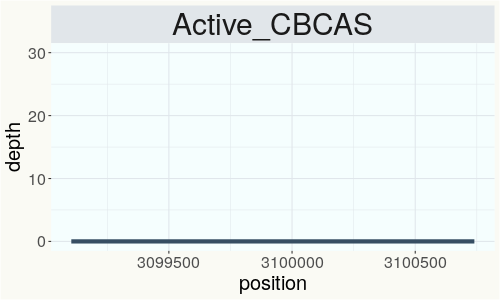
This chart represents the Illumina sequence coverage over the CBCA synthase gene.
Variants (THCAS, CBDAS, and CBCAS)
No variants to report
Variants (Select Genes of Interest)
| PKSG-2a | c.67T>A | p.Phe23Ile | missense variant | moderate | contig700 | 1945567 | A/T | |
| PKSG-2a | c.31A>T | p.Thr11Ser | missense variant | moderate | contig700 | 1945603 | T/A | |
| PKSG-2b | c.995C>T | p.Ser332Phe | missense variant | moderate | contig700 | 1950643 | G/A |
|
| aPT4 | c.470T>C | p.Leu157Ser | missense variant | moderate | contig121 | 2830665 | T/C |
|
| aPT1 | c.406A>G | p.Ile136Val | missense variant | moderate | contig121 | 2839605 | A/G | |
| aPT1 | c.629C>T | p.Thr210Ile | missense variant | moderate | contig121 | 2840237 | C/T | |
| aPT1 | c.727G>T | p.Glu243* | stop gained | high | contig121 | 2841362 | G/T |
Nearest genetic relatives (All Samples)
- 0.232 KYRG-151 (RSP11052)
- 0.237 Tak-HN (RSP11618)
- 0.239 KYRG-11 (RSP11051)
- 0.239 SCN (SRR14708201)
- 0.239 Kyrgyz Gold (RSP11054)
- 0.240 YNN (SRR14708199)
- 0.240 QHI (SRR14708202)
- 0.243 R3in134 (SRR14708220)
- 0.243 IMA (SRR14708203)
- 0.244 R2in135 (SRR14708221)
- 0.245 R4 (RSP11617)
- 0.246 GXI (SRR14708198)
- 0.247 Santhica 27 (RSP10665)
- 0.248 Santhica27 (RSP10056)
- 0.248 IBR3 (SRR14708249)
- 0.249 R2 (RSP11615)
- 0.250 Harlox (RSP10641)
- 0.250 R3 (RSP11616)
- 0.250 Santhica27 (RSP11046)
- 0.251 IUL2 (SRR14708253)
Most genetically distant strains (All Samples)
- 0.431 Chem 91 (RSP11185)
- 0.428 Cherry Blossom (RSP11318)
- 0.424 Cherry Blossom (RSP11323)
- 0.404 Cherry Blossom (RSP11301)
- 0.403 Cherry Blossom (RSP11325)
- 0.402 Cherry Blossom (RSP11312)
- 0.402 Cherry Blossom (RSP11322)
- 0.400 Chematonic -Cannatonic x Chemdawg- (RSP11394)
- 0.399 GG4 (RSP11978)
- 0.399 Cherry Blossom (RSP11306)
- 0.394 Cherry Blossom (RSP11298)
- 0.394 Cherry Blossom (RSP11300)
- 0.393 Cherry Blossom (RSP11315)
- 0.393 GMO x Garlic Breath (RSP12507)
- 0.389 New York City Deisel (RSP11225)
- 0.389 Escape Velocity (RSP11165)
- 0.387 Cherry Blossom (RSP11329)
- 0.387 Cherry Blossom (RSP11328)
- 0.387 Cherry Blossom (RSP11311)
- 0.386 Wife (RSP11148)
Nearest genetic relative in Phylos dataset
- Overlapping SNPs:
- 106
- Concordance:
- 70
Nearest genetic relative in Lynch dataset
- Overlapping SNPs:
- 7
- Concordance:
- 6
Blockchain Registration Information
- Transaction ID
-
781bab208fe41bbe
36c649af26e9ca50 b3ca7a29e9e31da2 72600e314d71e023 - Stamping Certificate
- Download PDF (863.3 KB)
- SHASUM Hash
-
6430b6f0a09ffa0ff36515fc553ef979 704002d9968b770f 2305b092eeb35585
