UP Sunrise
RSP 10989
Grower: UP Farms
General Information
- Sample Name
- 399 4446 us
- Accession Date
- July 17, 2017
- Reported Plant Sex
- Female
- Report Type
- StrainSEEK v2 3.2Mb
- DNA Extracted From
- Unknown
The strain rarity visualization shows how distant the strain is from the other cultivars in the Kannapedia database. The y-axis represents genetic distance, getting farther as you go up. The width of the visualization at any position along the y-axis shows how many strains there are in the database at that genetic distance. So, a common strain will have a more bottom-heavy shape, while uncommon and rare cultivars will have a visualization that is generally shifted towards the top.
Chemical Information
Cannabinoid and terpenoid information provided by the grower.
Cannabinoids
- THC + THCA
- 16.27%
- CBD + CBDA
- 0.061%
- THCV + THCVA
- 0.009%
- CBC + CBCA
- n/a
- CBG + CBGA
- 0.346%
- CBN + CBNA
- n/a
Terpenoids
- α-Bisabolol
- 0.07%
- Borneol
- n/a
- Camphene
- n/a
- Carene
- n/a
- Caryophyllene oxide
- 0.01%
- β-Caryophyllene
- 0.12%
- Fenchol
- 0.01%
- Geraniol
- n/a
- α-Humulene
- 0.05%
- Limonene
- 0.05%
- Linalool
- 0.03%
- Myrcene
- 0.372%
- α-Phellandrene
- n/a
- Terpinolene
- n/a
- α-Terpineol
- n/a
- α-Terpinene
- n/a
- γ-Terpinene
- n/a
- Total Nerolidol
- 0.06%
- Total Ocimene
- n/a
- α-Pinene
- 0.06%
- β-Pinene
- 0.04%
Genetic Information
- Plant Type
- Type I
File Downloads
The bell curve in the heterozygosity visualization shows the distribution of heterozygosity levels for cannabis cultivars in the Kannapedia database. The green line shows where this particular strain fits within the distribution. Heterozygosity is associated with heterosis (aka hybrid vigor) but also leads to the production of more variable offspring. When plants have two genetically different parents, heterozygosity levels will be higher than if it has been inbred or backcrossed repeatedly.
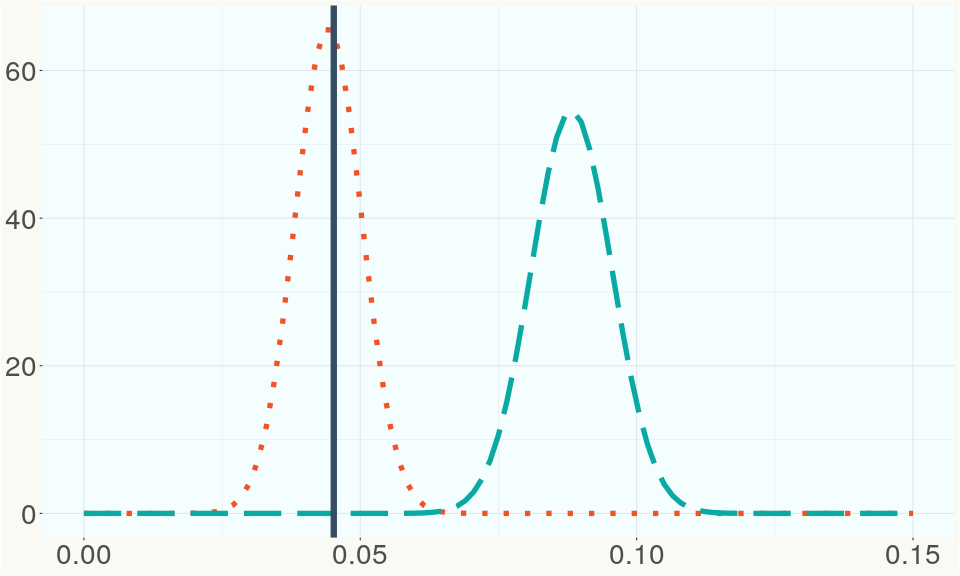
The ratio of reads mapped to Y-contigs to reads mapped to the whole Cannabis genome (Y-ratios) has been demonstrated to be strongly correlated with plant sex typing. This plot shows the distribution of Y-ratios for all samples in our database which were sequenced with the same method (panel or WGS) as this sample and where this sample falls in the distribution.
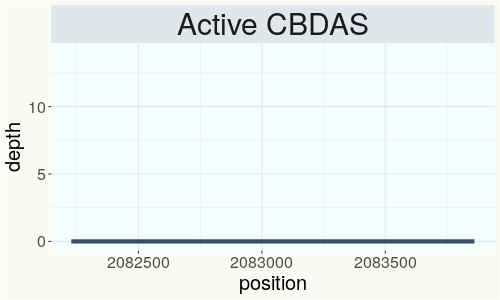
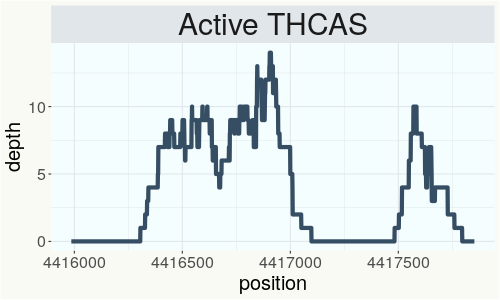
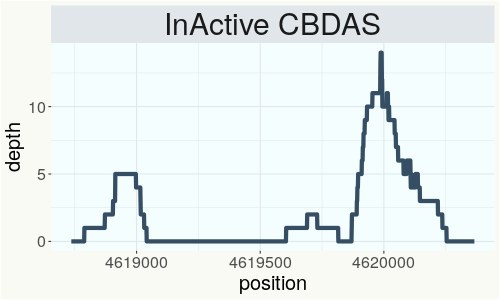
This chart represents the Illumina sequence coverage over the Bt/Bd allele. These are the three regions in the cannabis genome that impact THCA, CBDA, CBGA production. Coverage over the Active CBDAS gene is highly correlated with Type II and Type III plants as described by Etienne de Meijer. Coverage over the THCA gene is highly correlated with Type I and Type II plants but is anti-correlated with Type III plants. Type I plants require coverage over the inactive CBDA loci and no coverage over the Active CBDA gene. Lack of coverage over the Active CBDA and Active THCA allele are presumed to be Type IV plants (CBGA dominant). While deletions of entire THCAS and CBDAS genes are the most common Bt:Bd alleles observed, it is possible to have plants with these genes where functional expression of the enzyme is disrupted by deactivating point mutations (Kojoma et al. 2006).
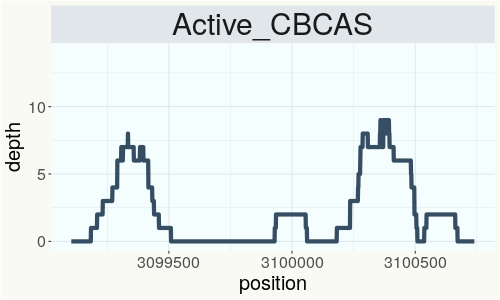
This chart represents the Illumina sequence coverage over the CBCA synthase gene.
Variants (THCAS, CBDAS, and CBCAS)
No variants to report
Variants (Select Genes of Interest)
No variants to report
Nearest genetic relatives (All Samples)
- 0.104 Calm (RSP11379)
- 0.128 Lift (RSP11378)
- 0.132 Electra (RSP11366)
- 0.141 Blue Dream (RSP11004)
- 0.149 Blue Dream (RSP11007)
- 0.156 Serious Happiness (RSP10763)
- 0.157 Doug s Varin (RSP11243)
- 0.160 Joy (RSP11380)
- 0.160 PWE (RSP11369)
- 0.167 Italian Kiss (RSP11034)
- 0.170 BLACK JACK (RSP11346)
- 0.170 Italian Kiss (RSP10990)
- 0.172 Black Jack (RSP10603)
- 0.173 Gelato OG (RSP11457)
- 0.175 Blue Dream (RSP11006)
- 0.175 OR 05MAY2017 (RSP10940)
- 0.176 Blue Dream (RSP11010)
- 0.177 UP The Straits (RSP11260)
- 0.178 Blue Dream (RSP11017)
- 0.178 Blue Dream (RSP11008)
Most genetically distant strains (All Samples)
- 0.427 Feral (RSP11205)
- 0.397 Carmaleonte (RSP11207)
- 0.397 Red Eye OG (RSP11190)
- 0.396 BagSeed (RSP12627)
- 0.395 Fatso (RSP11741)
- 0.391 RKM-2018-012 (RSP11103)
- 0.390 BagSeed (RSP12501)
- 0.389 CHEM4 (RSP12090)
- 0.385 Kush Hemp E1 (RSP11128)
- 0.385 Feral (RSP10890)
- 0.384 Cherry Blossom (RSP11323)
- 0.384 R3in134 (SRR14708220)
- 0.384 Cherry Blossom (RSP11311)
- 0.383 RKM-2018-002 (RSP11093)
- 0.378 80E (RSP11213)
- 0.378 Feral (RSP10892)
- 0.377 IBR1 (SRR14708251)
- 0.376 Absolute OG (RSP11455)
- 0.375 Cherry Blossom (RSP11333)
- 0.374 RKM-2018-026 (RSP11118)
Nearest genetic relative in Phylos dataset
- Overlapping SNPs:
- 46
- Concordance:
- 39
Nearest genetic relative in Lynch dataset
- Overlapping SNPs:
- 4
- Concordance:
- 4
Blockchain Registration Information
- Transaction ID
-
7cdb0414acade641
68ac146dc8dc05cc 385bb9cf40d8f5ff f2da18e337c53b46 - Stamping Certificate
- Download PDF (852.6 KB)
- SHASUM Hash
-
fc9b1759b4551b517e5e7b19327533d2 e429e4836622d22c 4df95981c70494ac
