White Label 1
RSP 11336
General Information
- Sample Name
- THCCO 1
- Accession Date
- October 17, 2019
- Reported Plant Sex
- Female
- Report Type
- StrainSEEK v2 3.2Mb
- DNA Extracted From
- Stem
The strain rarity visualization shows how distant the strain is from the other cultivars in the Kannapedia database. The y-axis represents genetic distance, getting farther as you go up. The width of the visualization at any position along the y-axis shows how many strains there are in the database at that genetic distance. So, a common strain will have a more bottom-heavy shape, while uncommon and rare cultivars will have a visualization that is generally shifted towards the top.
Chemical Information
Cannabinoid and terpenoid information provided by the grower.
Cannabinoids
No information provided.
Terpenoids
No information provided.
Genetic Information
- Plant Type
- Type I
File Downloads
The bell curve in the heterozygosity visualization shows the distribution of heterozygosity levels for cannabis cultivars in the Kannapedia database. The green line shows where this particular strain fits within the distribution. Heterozygosity is associated with heterosis (aka hybrid vigor) but also leads to the production of more variable offspring. When plants have two genetically different parents, heterozygosity levels will be higher than if it has been inbred or backcrossed repeatedly.
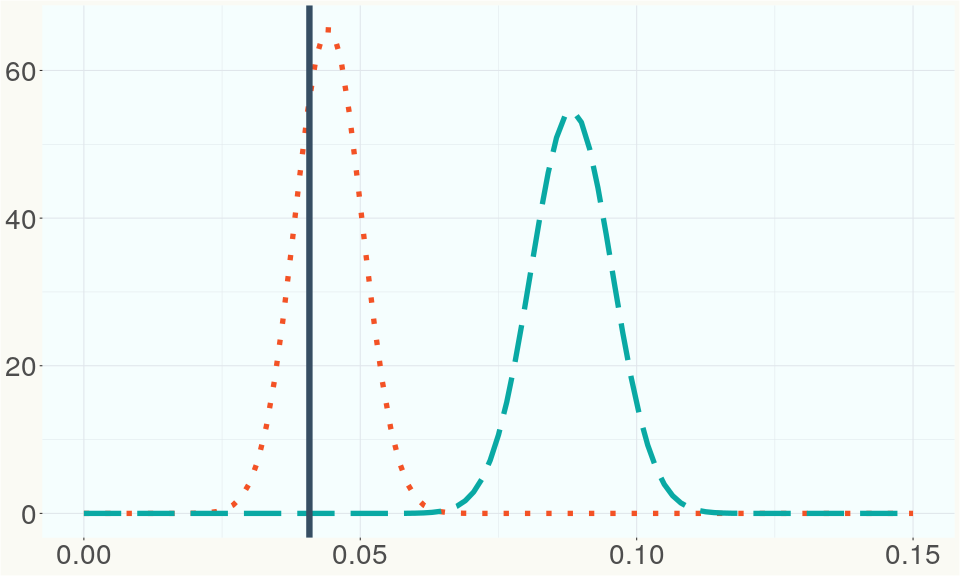
The ratio of reads mapped to Y-contigs to reads mapped to the whole Cannabis genome (Y-ratios) has been demonstrated to be strongly correlated with plant sex typing. This plot shows the distribution of Y-ratios for all samples in our database which were sequenced with the same method (panel or WGS) as this sample and where this sample falls in the distribution.
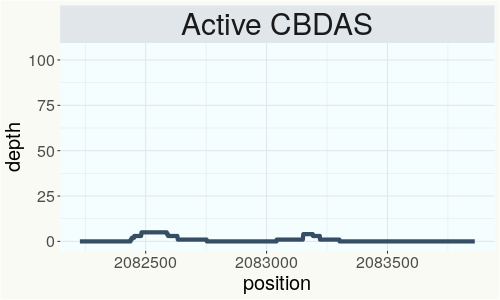
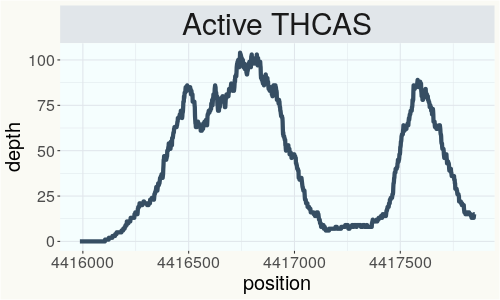
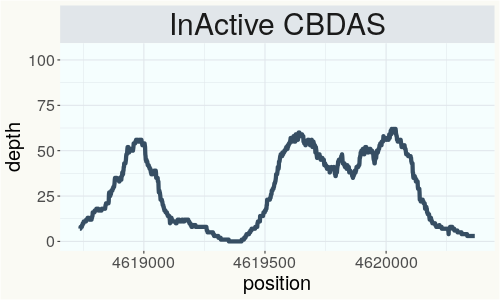
This chart represents the Illumina sequence coverage over the Bt/Bd allele. These are the three regions in the cannabis genome that impact THCA, CBDA, CBGA production. Coverage over the Active CBDAS gene is highly correlated with Type II and Type III plants as described by Etienne de Meijer. Coverage over the THCA gene is highly correlated with Type I and Type II plants but is anti-correlated with Type III plants. Type I plants require coverage over the inactive CBDA loci and no coverage over the Active CBDA gene. Lack of coverage over the Active CBDA and Active THCA allele are presumed to be Type IV plants (CBGA dominant). While deletions of entire THCAS and CBDAS genes are the most common Bt:Bd alleles observed, it is possible to have plants with these genes where functional expression of the enzyme is disrupted by deactivating point mutations (Kojoma et al. 2006).
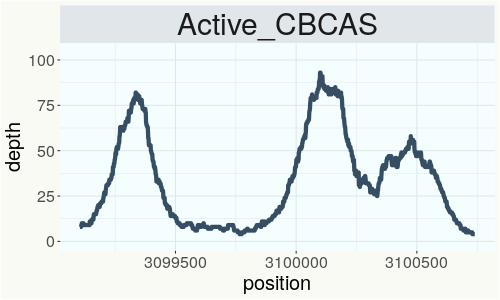
This chart represents the Illumina sequence coverage over the CBCA synthase gene.
Variants (THCAS, CBDAS, and CBCAS)
Variants (Select Genes of Interest)
| PKSG-2a | c.67T>A | p.Phe23Ile | missense variant | moderate | contig700 | 1945567 | A/T | |
| PKSG-2a | c.31A>T | p.Thr11Ser | missense variant | moderate | contig700 | 1945603 | T/A | |
| PKSG-2b | c.1152T>A | p.Asn384Lys | missense variant | moderate | contig700 | 1950486 | A/T | |
| PKSG-2b | c.1132C>G | p.Leu378Val | missense variant | moderate | contig700 | 1950506 | G/C |
|
| PKSG-2b | c.1117A>G | p.Ile373Val | missense variant | moderate | contig700 | 1950521 | T/C | |
| PKSG-2b | c.948T>G | p.Asp316Glu | missense variant | moderate | contig700 | 1950690 | A/C |
|
| PKSG-2b | c.945T>G | p.Ser315Arg | missense variant | moderate | contig700 | 1950693 | A/C |
|
| PKSG-2b | c.944G>A | p.Ser315Asn | missense variant | moderate | contig700 | 1950694 | C/T |
|
| PKSG-2b | c.934C>G | p.His312Asp | missense variant | moderate | contig700 | 1950704 | G/C |
|
| PKSG-2b | c.31A>T | p.Thr11Ser | missense variant | moderate | contig700 | 1951851 | T/A | |
| PKSG-2b | c.-2_1dupATA | start lost & conservative inframe insertion | high | contig700 | 1951880 | A/ATAT |
|
|
| DXR-2 | c.1319T>C | p.Ile440Thr | missense variant | moderate | contig380 | 285250 | A/G |
|
| aPT4 | c.97T>C | p.Tyr33His | missense variant | moderate | contig121 | 2828753 | T/C |
|
| aPT4 | c.153A>C | p.Lys51Asn | missense variant | moderate | contig121 | 2828809 | A/C |
|
| aPT4 | c.775delT | p.Tyr259fs | frameshift variant | high | contig121 | 2831380 | AT/A |
|
| aPT4 | c.1168T>C | p.Tyr390His | missense variant | moderate | contig121 | 2833503 | T/C |
|
| aPT1 | c.406A>G | p.Ile136Val | missense variant | moderate | contig121 | 2839605 | A/G | |
| aPT1 | c.629C>T | p.Thr210Ile | missense variant | moderate | contig121 | 2840237 | C/T | |
| HDS-2 |
c.82_93delGT |
p.Val28_Thr3 |
conservative inframe deletion | moderate | contig95 | 1989748 |
CGTAACCGGAAC |
|
| HDS-2 | c.127T>G | p.Ser43Ala | missense variant | moderate | contig95 | 1989794 | T/G |
|
Nearest genetic relatives (All Samples)
- 0.175 Headcheese (RSP11192)
- 0.179 RKM-2018-025 (RSP11117)
- 0.180 RKM-2018-016 (RSP11108)
- 0.184 BLACK JACK (RSP11346)
- 0.191 Black Jack (RSP10603)
- 0.203 RKM-2018-027 (RSP11119)
- 0.216 Saint Jack (RSP11179)
- 0.225 Gold Cracker (RSP11048)
- 0.242 Gold Cracker (RSP11041)
- 0.242 Tangerine Haze (RSP10995)
- 0.245 Cheese (RSP10460)
- 0.246 Durban Poison (RSP10998)
- 0.247 Durban Poison #1 (RSP10996)
- 0.251 CST (RSP11002)
- 0.254 Durban Poison #1 (RSP11013)
- 0.255 Power Plant (RSP11223)
- 0.256 Durban Poison (RSP11014)
- 0.260 Dominion Skunk (RSP11354)
- 0.261 Durban Poison (RSP11226)
- 0.267 UP Sunrise (RSP10989)
Most genetically distant strains (All Samples)
- 0.536 Cherry Blossom (RSP11323)
- 0.487 Cherry Blossom (RSP11274)
- 0.483 Cherry Blossom (RSP11312)
- 0.476 Cherry Blossom (RSP11327)
- 0.467 Chematonic -Cannatonic x Chemdawg- (RSP11394)
- 0.462 Cherry Blossom (RSP11309)
- 0.460 Tanao Sri -46- (RSP11486)
- 0.458 Cherry Blossom (RSP11298)
- 0.457 Cherry Blossom (RSP11328)
- 0.455 Cherry Blossom (RSP11316)
- 0.454 Cherry Blossom (RSP11318)
- 0.451 Cherry Blossom (RSP11330)
- 0.450 Cherry Blossom (RSP11331)
- 0.446 Cherry Blossom CBG (RSP11303)
- 0.443 Cherry Blossom (RSP11306)
- 0.443 Cherry Blossom (RSP11314)
- 0.443 Avidekel 05MAY2017 (RSP10938)
- 0.440 Cherry Blossom (RSP11299)
- 0.438 Cherry Blossom (RSP11315)
- 0.437 R1 (RSP11483)
Nearest genetic relative in Phylos dataset
- Overlapping SNPs:
- 66
- Concordance:
- 64
Nearest genetic relative in Lynch dataset
- Overlapping SNPs:
- 5
- Concordance:
- 5
Blockchain Registration Information
- Transaction ID
-
e31e1f2be73d735f
d084c979e423d45b 61ebb93a9c8688f4 1a837da2aa54d42e - Stamping Certificate
- Download PDF (858.1 KB)
- SHASUM Hash
-
d5ed692af64425f7dd5867aaf192a791 e6d077e55e62014a 722b7e288b79709d
