JL_X_NSPM1_5
RSP 11467
Grower: Kevin McKernan
General Information
- Accession Date
- May 7, 2020
- Reported Plant Sex
- Male
- Report Type
- StrainSEEK v2 3.2Mb
- DNA Extracted From
- Stem
The strain rarity visualization shows how distant the strain is from the other cultivars in the Kannapedia database. The y-axis represents genetic distance, getting farther as you go up. The width of the visualization at any position along the y-axis shows how many strains there are in the database at that genetic distance. So, a common strain will have a more bottom-heavy shape, while uncommon and rare cultivars will have a visualization that is generally shifted towards the top.
Chemical Information
Cannabinoid and terpenoid information provided by the grower.
Cannabinoids
No information provided.
Terpenoids
No information provided.
Genetic Information
- Plant Type
- Type II
File Downloads
The bell curve in the heterozygosity visualization shows the distribution of heterozygosity levels for cannabis cultivars in the Kannapedia database. The green line shows where this particular strain fits within the distribution. Heterozygosity is associated with heterosis (aka hybrid vigor) but also leads to the production of more variable offspring. When plants have two genetically different parents, heterozygosity levels will be higher than if it has been inbred or backcrossed repeatedly.
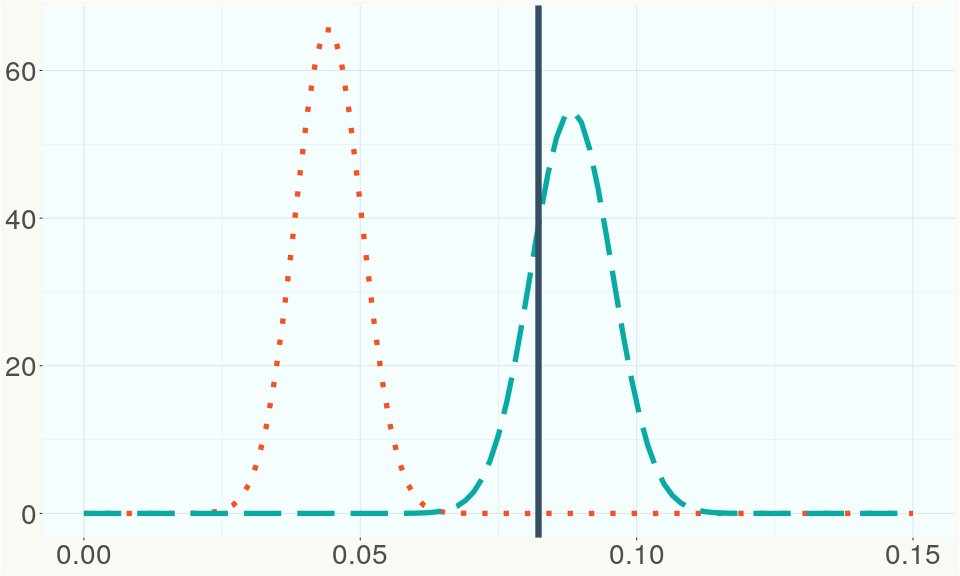
The ratio of reads mapped to Y-contigs to reads mapped to the whole Cannabis genome (Y-ratios) has been demonstrated to be strongly correlated with plant sex typing. This plot shows the distribution of Y-ratios for all samples in our database which were sequenced with the same method (panel or WGS) as this sample and where this sample falls in the distribution.
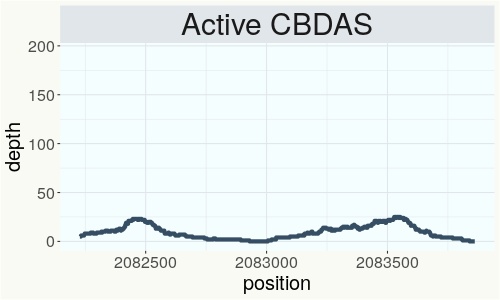
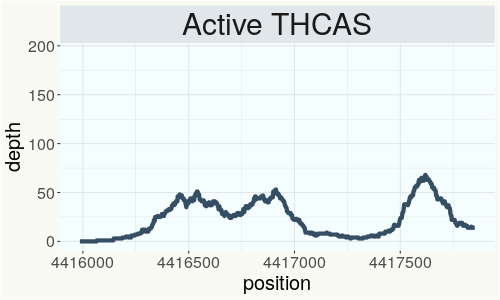
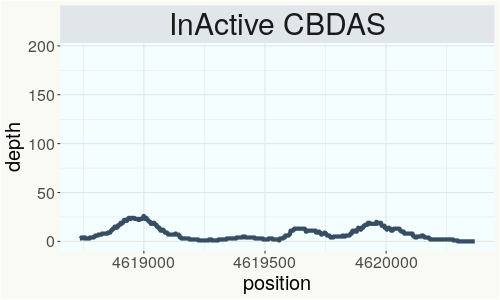
This chart represents the Illumina sequence coverage over the Bt/Bd allele. These are the three regions in the cannabis genome that impact THCA, CBDA, CBGA production. Coverage over the Active CBDAS gene is highly correlated with Type II and Type III plants as described by Etienne de Meijer. Coverage over the THCA gene is highly correlated with Type I and Type II plants but is anti-correlated with Type III plants. Type I plants require coverage over the inactive CBDA loci and no coverage over the Active CBDA gene. Lack of coverage over the Active CBDA and Active THCA allele are presumed to be Type IV plants (CBGA dominant). While deletions of entire THCAS and CBDAS genes are the most common Bt:Bd alleles observed, it is possible to have plants with these genes where functional expression of the enzyme is disrupted by deactivating point mutations (Kojoma et al. 2006).
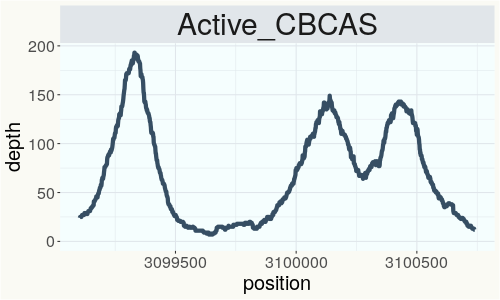
This chart represents the Illumina sequence coverage over the CBCA synthase gene.
Variants (THCAS, CBDAS, and CBCAS)
No variants to report
Variants (Select Genes of Interest)
| PKSG-2a | c.67T>A | p.Phe23Ile | missense variant | moderate | contig700 | 1945567 | A/T | |
| PKSG-2a | c.31A>T | p.Thr11Ser | missense variant | moderate | contig700 | 1945603 | T/A | |
| PKSG-2b | c.1152T>A | p.Asn384Lys | missense variant | moderate | contig700 | 1950486 | A/T | |
| PKSG-2b | c.1132C>G | p.Leu378Val | missense variant | moderate | contig700 | 1950506 | G/C |
|
| PKSG-2b | c.1117A>G | p.Ile373Val | missense variant | moderate | contig700 | 1950521 | T/C | |
| PKSG-2b | c.781T>A | p.Leu261Ile | missense variant | moderate | contig700 | 1950857 | A/T |
|
| PKSG-2b | c.774G>A | p.Met258Ile | missense variant | moderate | contig700 | 1950864 | C/T | |
| PKSG-2b | c.31A>T | p.Thr11Ser | missense variant | moderate | contig700 | 1951851 | T/A | |
| PKSG-4b |
c.535_545del |
p.Ile179fs | frameshift variant | high | contig700 | 2721127 |
CCCCACTCCAAT |
|
| PKSG-4b | c.523C>T | p.His175Tyr | missense variant | moderate | contig700 | 2721150 | G/A | |
| PKSG-4b | c.489delT | p.Phe163fs | frameshift variant | high | contig700 | 2721183 | CA/C | |
| PKSG-4b |
c.353_354ins |
p.Gly119fs | frameshift variant | high | contig700 | 2721319 | T/TGG |
|
| DXR-2 | c.1319T>C | p.Ile440Thr | missense variant | moderate | contig380 | 285250 | A/G |
|
| aPT4 | c.97T>C | p.Tyr33His | missense variant | moderate | contig121 | 2828753 | T/C |
|
| aPT4 |
c.235_236del |
p.Val79fs | frameshift variant | high | contig121 | 2829030 | ATG/A |
|
| aPT4 | c.238delT | p.Ser80fs | frameshift variant | high | contig121 | 2829034 | AT/A |
|
| aPT4 | c.1168T>C | p.Tyr390His | missense variant | moderate | contig121 | 2833503 | T/C |
|
| aPT1 |
c.95_97delGT |
p.Cys32del | disruptive inframe deletion | moderate | contig121 | 2835800 | ATGT/A | |
| aPT1 | c.406A>G | p.Ile136Val | missense variant | moderate | contig121 | 2839605 | A/G | |
| HDS-2 |
c.82_93delGT |
p.Val28_Thr3 |
conservative inframe deletion | moderate | contig95 | 1989748 |
CGTAACCGGAAC |
|
| HDS-2 | c.127T>G | p.Ser43Ala | missense variant | moderate | contig95 | 1989794 | T/G |
|
Nearest genetic relatives (All Samples)
- 0.074 JL X NSPM1 22 (RSP11475)
- 0.076 JL X NSPM1 30 (RSP11476)
- 0.084 JL Cross 23 (RSP11524)
- 0.086 JL Cross 15 (RSP11516)
- 0.094 JL x NSPM1 1 (RSP11478)
- 0.100 JL X NSPM1 33 (RSP11477)
- 0.102 JL Tent 1 yellow stake (RSP11488)
- 0.105 JL x NSPM1 1 5 (RSP11479)
- 0.107 JL x NSPM1 2 (RSP11480)
- 0.107 JL Cross 9 (RSP11510)
- 0.108 JL X NSPM1 21 (RSP11474)
- 0.111 JL Cross 24 (RSP11525)
- 0.114 JL X NSPM1 14 (RSP11473)
- 0.115 JL Cross 22 (RSP11523)
- 0.116 JL Cross 19 (RSP11520)
- 0.118 JL Cross 21 (RSP11522)
- 0.121 JL Cross 27 (RSP11528)
- 0.121 JL X NSPM1 11 (RSP11471)
- 0.124 JL Tent 2 (RSP11489)
- 0.124 JL X NSPM1 7 (RSP11469)
Most genetically distant strains (All Samples)
- 0.455 80E (RSP11213)
- 0.441 Cbot-2019-005 (RSP11133)
- 0.436 80E (RSP11212)
- 0.432 Northern Lights (RSP11501)
- 0.429 CS (RSP11208)
- 0.429 R1in136 (SRR14708226)
- 0.426 R1in136 (SRR14708227)
- 0.425 80E (RSP11211)
- 0.422 R1in136 (SRR14708237)
- 0.422 Carmagnola (RSP11202)
- 0.421 Ruderalis Indica (SRR14708267)
- 0.418 XBL1 (SRR14708207)
- 0.416 Tanao Sri-white -80- (RSP11621)
- 0.416 Arcata Trainwreck (RSP11176)
- 0.415 Cherry Blossom (RSP11323)
- 0.414 Carmaleonte (RSP11207)
- 0.413 Juso14 (SRR14708259)
- 0.412 BagSeed (RSP12627)
- 0.412 IUP3 (SRR14708256)
- 0.409 Tanao Sri -46- (RSP11486)
Nearest genetic relative in Phylos dataset
- Overlapping SNPs:
- 65
- Concordance:
- 41
Nearest genetic relative in Lynch dataset
- Overlapping SNPs:
- 9
- Concordance:
- 9
Blockchain Registration Information
- Transaction ID
-
6a628c2e26232e95
118ae7ef2395adc3 4fe6f375da6e9993 265a827217415fff - Stamping Certificate
- Download PDF (39.4 KB)
- SHASUM Hash
-
53f69e13423caa8de0b151866cd3b88b 6028221cd38231f0 83169f9a0dab1908
