JL_X_NSPM1_21
RSP 11474
Grower: Kevin McKernan
General Information
- Accession Date
- May 7, 2020
- Reported Plant Sex
- Male
- Report Type
- StrainSEEK v2 3.2Mb
- DNA Extracted From
- Stem
The strain rarity visualization shows how distant the strain is from the other cultivars in the Kannapedia database. The y-axis represents genetic distance, getting farther as you go up. The width of the visualization at any position along the y-axis shows how many strains there are in the database at that genetic distance. So, a common strain will have a more bottom-heavy shape, while uncommon and rare cultivars will have a visualization that is generally shifted towards the top.
Chemical Information
Cannabinoid and terpenoid information provided by the grower.
Cannabinoids
No information provided.
Terpenoids
No information provided.
Genetic Information
- Plant Type
- Type I
File Downloads
The bell curve in the heterozygosity visualization shows the distribution of heterozygosity levels for cannabis cultivars in the Kannapedia database. The green line shows where this particular strain fits within the distribution. Heterozygosity is associated with heterosis (aka hybrid vigor) but also leads to the production of more variable offspring. When plants have two genetically different parents, heterozygosity levels will be higher than if it has been inbred or backcrossed repeatedly.
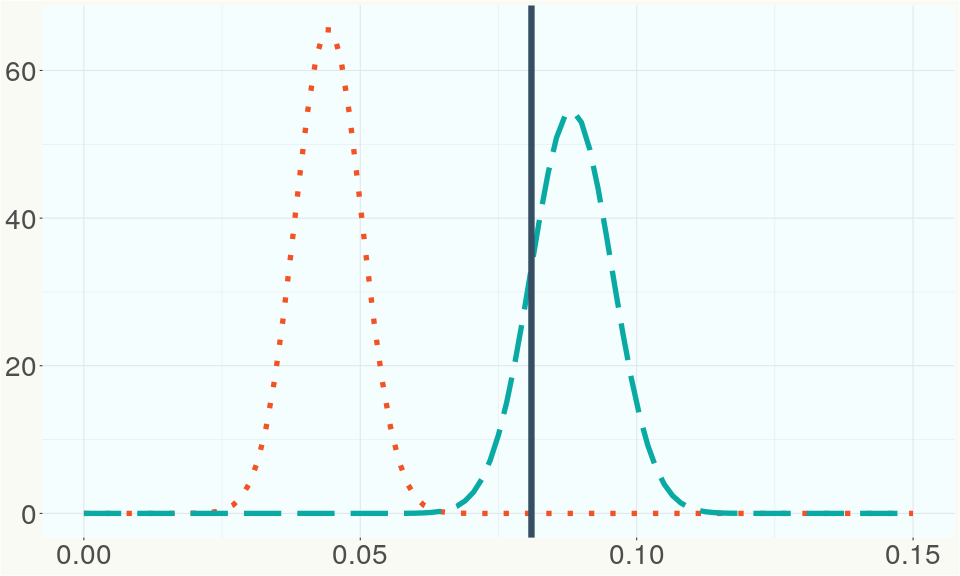
The ratio of reads mapped to Y-contigs to reads mapped to the whole Cannabis genome (Y-ratios) has been demonstrated to be strongly correlated with plant sex typing. This plot shows the distribution of Y-ratios for all samples in our database which were sequenced with the same method (panel or WGS) as this sample and where this sample falls in the distribution.
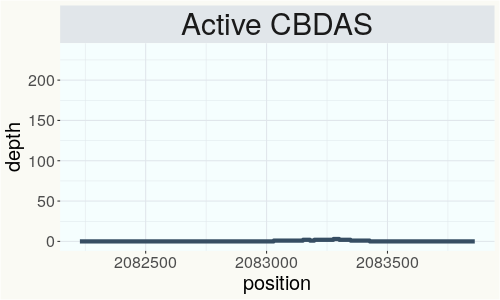
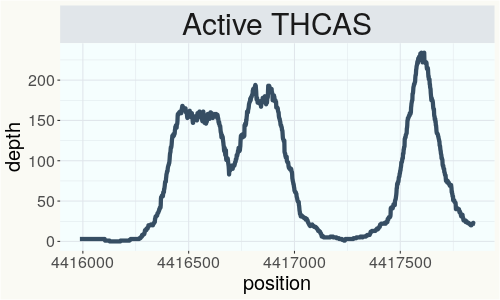
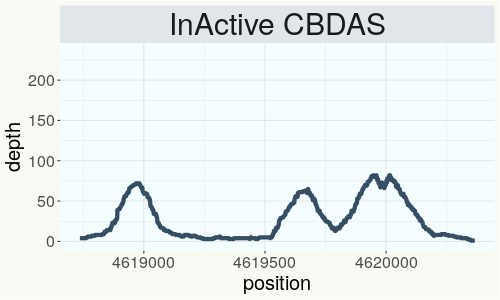
This chart represents the Illumina sequence coverage over the Bt/Bd allele. These are the three regions in the cannabis genome that impact THCA, CBDA, CBGA production. Coverage over the Active CBDAS gene is highly correlated with Type II and Type III plants as described by Etienne de Meijer. Coverage over the THCA gene is highly correlated with Type I and Type II plants but is anti-correlated with Type III plants. Type I plants require coverage over the inactive CBDA loci and no coverage over the Active CBDA gene. Lack of coverage over the Active CBDA and Active THCA allele are presumed to be Type IV plants (CBGA dominant). While deletions of entire THCAS and CBDAS genes are the most common Bt:Bd alleles observed, it is possible to have plants with these genes where functional expression of the enzyme is disrupted by deactivating point mutations (Kojoma et al. 2006).
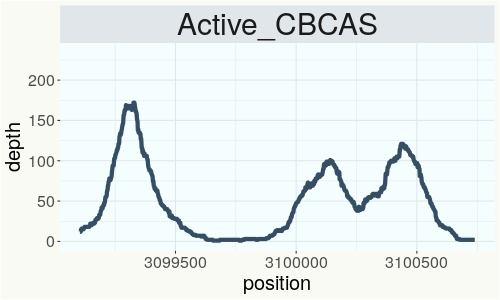
This chart represents the Illumina sequence coverage over the CBCA synthase gene.
Variants (THCAS, CBDAS, and CBCAS)
Variants (Select Genes of Interest)
| PKSG-2a | c.67T>A | p.Phe23Ile | missense variant | moderate | contig700 | 1945567 | A/T | |
| PKSG-2a | c.31A>T | p.Thr11Ser | missense variant | moderate | contig700 | 1945603 | T/A | |
| PKSG-2b | c.1152T>A | p.Asn384Lys | missense variant | moderate | contig700 | 1950486 | A/T | |
| PKSG-2b | c.1132C>G | p.Leu378Val | missense variant | moderate | contig700 | 1950506 | G/C |
|
| PKSG-2b | c.1117A>G | p.Ile373Val | missense variant | moderate | contig700 | 1950521 | T/C | |
| PKSG-2b | c.31A>T | p.Thr11Ser | missense variant | moderate | contig700 | 1951851 | T/A | |
| PKSG-4b |
c.535_545del |
p.Ile179fs | frameshift variant | high | contig700 | 2721127 |
CCCCACTCCAAT |
|
| PKSG-4b | c.523C>T | p.His175Tyr | missense variant | moderate | contig700 | 2721150 | G/A | |
| PKSG-4b | c.489delT | p.Phe163fs | frameshift variant | high | contig700 | 2721183 | CA/C | |
| PKSG-4b |
c.353_354ins |
p.Gly119fs | frameshift variant | high | contig700 | 2721319 | T/TGG |
|
| DXR-2 | c.1319T>C | p.Ile440Thr | missense variant | moderate | contig380 | 285250 | A/G |
|
| DXR-2 | c.431C>G | p.Ala144Gly | missense variant | moderate | contig380 | 287760 | G/C | |
| aPT4 | c.97T>C | p.Tyr33His | missense variant | moderate | contig121 | 2828753 | T/C |
|
| aPT4 | c.153A>C | p.Lys51Asn | missense variant | moderate | contig121 | 2828809 | A/C |
|
| aPT4 | c.775delT | p.Tyr259fs | frameshift variant | high | contig121 | 2831380 | AT/A |
|
| aPT4 | c.1168T>C | p.Tyr390His | missense variant | moderate | contig121 | 2833503 | T/C |
|
| aPT1 | c.406A>G | p.Ile136Val | missense variant | moderate | contig121 | 2839605 | A/G | |
| aPT1 | c.629C>T | p.Thr210Ile | missense variant | moderate | contig121 | 2840237 | C/T | |
| HDS-2 |
c.82_93delGT |
p.Val28_Thr3 |
conservative inframe deletion | moderate | contig95 | 1989748 |
CGTAACCGGAAC |
|
| HDS-2 | c.127T>G | p.Ser43Ala | missense variant | moderate | contig95 | 1989794 | T/G |
|
| HDS-1 |
c.-108+1_-10 |
splice donor variant & intron variant | high | contig1891 | 889975 | A/AC |
|
Nearest genetic relatives (All Samples)
- 0.048 JL X NSPM1 14 (RSP11473)
- 0.071 JL X NSPM1 30 (RSP11476)
- 0.073 JL Cross 18 (RSP11519)
- 0.076 JL X NSPM1 7 (RSP11469)
- 0.078 JL Cross 23 (RSP11524)
- 0.092 JL Cross 22 (RSP11523)
- 0.093 JL X NSPM1 33 (RSP11477)
- 0.096 JL Tent 2 (RSP11489)
- 0.099 JL Cross 17 (RSP11518)
- 0.101 JL Cross 19 (RSP11520)
- 0.101 JL Tent 3 (RSP11490)
- 0.102 JL X NSPM1 22 (RSP11475)
- 0.103 JL x NSPM1 3 (RSP11481)
- 0.107 JL Cross 28 (RSP11529)
- 0.108 JL Cross 21 (RSP11522)
- 0.108 JL X NSPM1 5 (RSP11467)
- 0.113 JL Tent 4 (RSP11491)
- 0.114 JL x NSPM1 1 5 (RSP11479)
- 0.116 JL Cross 9 (RSP11510)
- 0.120 JL Cross 15 (RSP11516)
Most genetically distant strains (All Samples)
- 0.464 80E (RSP11213)
- 0.436 Cbot-2019-005 (RSP11133)
- 0.430 80E (RSP11211)
- 0.430 CS (RSP11208)
- 0.427 Arcata Trainwreck (RSP11176)
- 0.425 Northern Lights (RSP11501)
- 0.424 R1in136 (SRR14708226)
- 0.423 80E (RSP11212)
- 0.423 Carmagnola (RSP11202)
- 0.420 R1in136 (SRR14708237)
- 0.419 Cherry Blossom (RSP11323)
- 0.419 Ruderalis Indica (SRR14708267)
- 0.416 IUP3 (SRR14708256)
- 0.413 R1in136 (SRR14708227)
- 0.412 Carmaleonte (RSP11207)
- 0.412 IUP2 (SRR14708257)
- 0.412 Tanao Sri -46- (RSP11486)
- 0.411 Feral (RSP11205)
- 0.409 IBE (SRR14708228)
- 0.408 XBL1 (SRR14708207)
Nearest genetic relative in Phylos dataset
- Overlapping SNPs:
- 68
- Concordance:
- 42
Nearest genetic relative in Lynch dataset
- Overlapping SNPs:
- 2
- Concordance:
- 2
Blockchain Registration Information
- Transaction ID
-
f9dc6b520c512525
268c1478d9c2a981 19709f457aee5f34 aa8bc16d13fe22de - Stamping Certificate
- Download PDF (39.7 KB)
- SHASUM Hash
-
2955606a4a3184e68d2cfbaaaa9be74a c86742174493bebb f0814ed496cb0dc4
