JL_X_NSPM1_22
RSP 11475
Grower: Kevin McKernan
General Information
- Accession Date
- May 7, 2020
- Reported Plant Sex
- Male
- Report Type
- StrainSEEK v2 3.2Mb
- DNA Extracted From
- Stem
The strain rarity visualization shows how distant the strain is from the other cultivars in the Kannapedia database. The y-axis represents genetic distance, getting farther as you go up. The width of the visualization at any position along the y-axis shows how many strains there are in the database at that genetic distance. So, a common strain will have a more bottom-heavy shape, while uncommon and rare cultivars will have a visualization that is generally shifted towards the top.
Chemical Information
Cannabinoid and terpenoid information provided by the grower.
Cannabinoids
No information provided.
Terpenoids
No information provided.
Genetic Information
- Plant Type
- Type II
File Downloads
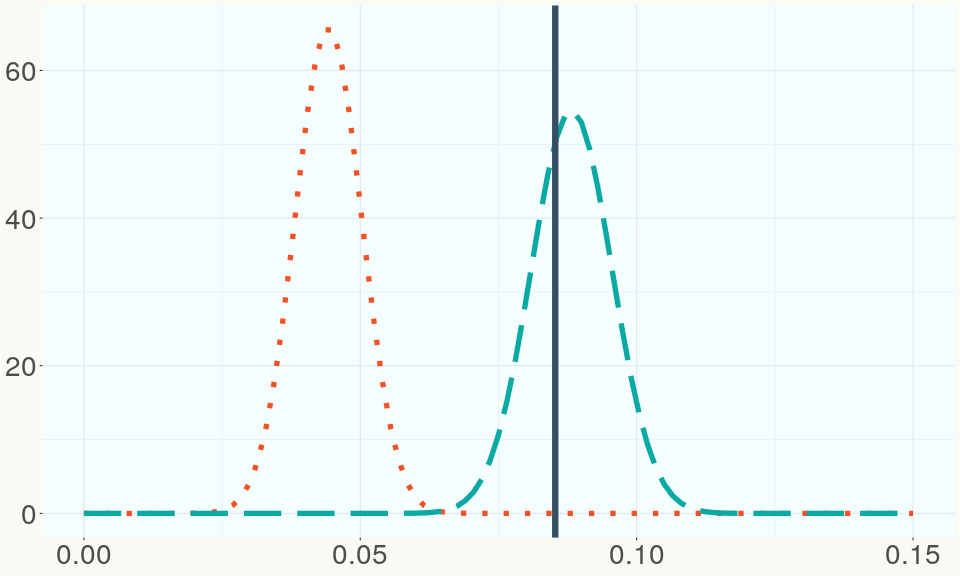
The bell curve in the heterozygosity visualization shows the distribution of heterozygosity levels for cannabis cultivars in the Kannapedia database. The green line shows where this particular strain fits within the distribution. Heterozygosity is associated with heterosis (aka hybrid vigor) but also leads to the production of more variable offspring. When plants have two genetically different parents, heterozygosity levels will be higher than if it has been inbred or backcrossed repeatedly.
The ratio of reads mapped to Y-contigs to reads mapped to the whole Cannabis genome (Y-ratios) has been demonstrated to be strongly correlated with plant sex typing. This plot shows the distribution of Y-ratios for all samples in our database which were sequenced with the same method (panel or WGS) as this sample and where this sample falls in the distribution.
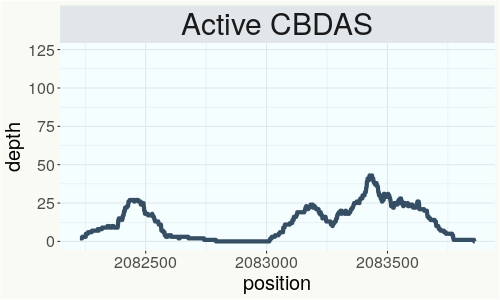
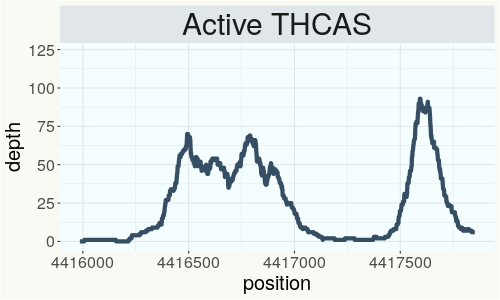
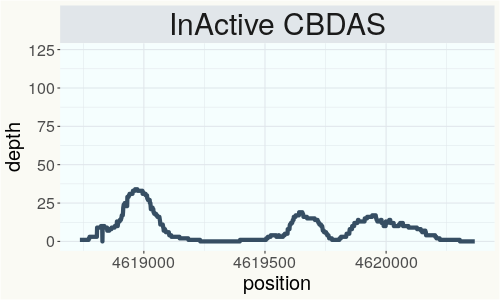
This chart represents the Illumina sequence coverage over the Bt/Bd allele. These are the three regions in the cannabis genome that impact THCA, CBDA, CBGA production. Coverage over the Active CBDAS gene is highly correlated with Type II and Type III plants as described by Etienne de Meijer. Coverage over the THCA gene is highly correlated with Type I and Type II plants but is anti-correlated with Type III plants. Type I plants require coverage over the inactive CBDA loci and no coverage over the Active CBDA gene. Lack of coverage over the Active CBDA and Active THCA allele are presumed to be Type IV plants (CBGA dominant). While deletions of entire THCAS and CBDAS genes are the most common Bt:Bd alleles observed, it is possible to have plants with these genes where functional expression of the enzyme is disrupted by deactivating point mutations (Kojoma et al. 2006).
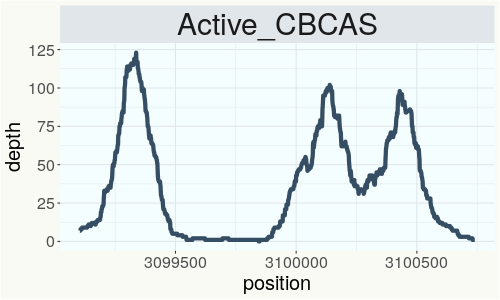
This chart represents the Illumina sequence coverage over the CBCA synthase gene.
Variants (THCAS, CBDAS, and CBCAS)
No variants to report
Variants (Select Genes of Interest)
| PKSG-2a | c.67T>A | p.Phe23Ile | missense variant | moderate | contig700 | 1945567 | A/T | |
| PKSG-2a | c.31A>T | p.Thr11Ser | missense variant | moderate | contig700 | 1945603 | T/A | |
| PKSG-2b | c.1152T>A | p.Asn384Lys | missense variant | moderate | contig700 | 1950486 | A/T | |
| PKSG-2b | c.1132C>G | p.Leu378Val | missense variant | moderate | contig700 | 1950506 | G/C |
|
| PKSG-2b | c.1117A>G | p.Ile373Val | missense variant | moderate | contig700 | 1950521 | T/C | |
| PKSG-2b | c.31A>T | p.Thr11Ser | missense variant | moderate | contig700 | 1951851 | T/A | |
| PKSG-4b |
c.535_545del |
p.Ile179fs | frameshift variant | high | contig700 | 2721127 |
CCCCACTCCAAT |
|
| PKSG-4b | c.523C>T | p.His175Tyr | missense variant | moderate | contig700 | 2721150 | G/A | |
| PKSG-4b | c.489delT | p.Phe163fs | frameshift variant | high | contig700 | 2721183 | CA/C | |
| PKSG-4b |
c.353_354ins |
p.Gly119fs | frameshift variant | high | contig700 | 2721319 | T/TGG |
|
| DXR-2 | c.431C>G | p.Ala144Gly | missense variant | moderate | contig380 | 287760 | G/C | |
| aPT4 |
c.235_236del |
p.Val79fs | frameshift variant | high | contig121 | 2829030 | ATG/A |
|
| aPT4 | c.238delT | p.Ser80fs | frameshift variant | high | contig121 | 2829034 | AT/A |
|
| aPT4 | c.1168T>C | p.Tyr390His | missense variant | moderate | contig121 | 2833503 | T/C |
|
| aPT1 |
c.95_97delGT |
p.Cys32del | disruptive inframe deletion | moderate | contig121 | 2835800 | ATGT/A | |
| aPT1 | c.406A>G | p.Ile136Val | missense variant | moderate | contig121 | 2839605 | A/G | |
| HDS-2 |
c.82_93delGT |
p.Val28_Thr3 |
conservative inframe deletion | moderate | contig95 | 1989748 |
CGTAACCGGAAC |
|
| HDS-2 | c.127T>G | p.Ser43Ala | missense variant | moderate | contig95 | 1989794 | T/G |
|
Nearest genetic relatives (All Samples)
- 0.046 JL X NSPM1 30 (RSP11476)
- 0.074 JL X NSPM1 5 (RSP11467)
- 0.075 JL Cross 22 (RSP11523)
- 0.091 JL Cross 17 (RSP11518)
- 0.093 JL X NSPM1 33 (RSP11477)
- 0.098 JL x NSPM1 1 5 (RSP11479)
- 0.101 JL x NSPM1 1 (RSP11478)
- 0.102 JL X NSPM1 21 (RSP11474)
- 0.105 JL X NSPM1 14 (RSP11473)
- 0.108 JL Tent 1 yellow stake (RSP11488)
- 0.109 JL X NSPM1 7 (RSP11469)
- 0.117 JL Cross 18 (RSP11519)
- 0.118 JL Cross 9 (RSP11510)
- 0.118 JL Cross 23 (RSP11524)
- 0.118 JL x NSPM1 3 (RSP11481)
- 0.118 JL X NSPM1 6 (RSP11468)
- 0.120 JL Cross 19 (RSP11520)
- 0.124 JL Cross 27 (RSP11528)
- 0.124 JL Tent 2 (RSP11489)
- 0.125 JL x NSPM1 2 (RSP11480)
Most genetically distant strains (All Samples)
- 0.469 80E (RSP11213)
- 0.442 80E (RSP11212)
- 0.438 80E (RSP11211)
- 0.426 Cbot-2019-005 (RSP11133)
- 0.422 IUP3 (SRR14708256)
- 0.420 Northern Lights (RSP11501)
- 0.419 R1in136 (SRR14708226)
- 0.416 Ruderalis Indica (SRR14708267)
- 0.415 CS (RSP11208)
- 0.414 Carmagnola (RSP11202)
- 0.413 R1in136 (SRR14708227)
- 0.409 XBL1 (SRR14708207)
- 0.408 Tanao Sri-white -80- (RSP11621)
- 0.408 Feral (RSP11205)
- 0.406 Carmaleonte (RSP11207)
- 0.406 Northern Skunk (RSP11456)
- 0.406 R1in136 (SRR14708237)
- 0.402 Arcata Trainwreck (RSP11176)
- 0.402 IUP2 (SRR14708257)
- 0.402 Cherry Blossom (RSP11323)
Nearest genetic relative in Phylos dataset
- Overlapping SNPs:
- 64
- Concordance:
- 40
Nearest genetic relative in Lynch dataset
- Overlapping SNPs:
- 2
- Concordance:
- 2
Blockchain Registration Information
- Transaction ID
-
bdeabd9b688cb1b9
a48732d67474913e e29e715aa403bdca 4d7b4bfe327e163f - Stamping Certificate
- Download PDF (39.9 KB)
- SHASUM Hash
-
ecca48ae1b5d0bdfba90bcd999f635e2 5de7fbcd455a02f7 abe40f9db2eac9a5
