JL Cross 18
RSP 11519
Grower: Kevin McKernan
General Information
- Accession Date
- June 17, 2020
- Reported Plant Sex
- not reported
- Report Type
- StrainSEEK v2 3.2Mb
- DNA Extracted From
- Unknown
The strain rarity visualization shows how distant the strain is from the other cultivars in the Kannapedia database. The y-axis represents genetic distance, getting farther as you go up. The width of the visualization at any position along the y-axis shows how many strains there are in the database at that genetic distance. So, a common strain will have a more bottom-heavy shape, while uncommon and rare cultivars will have a visualization that is generally shifted towards the top.
Chemical Information
Cannabinoid and terpenoid information provided by the grower.
Cannabinoids
No information provided.
Terpenoids
No information provided.
Genetic Information
- Plant Type
- Type II
File Downloads
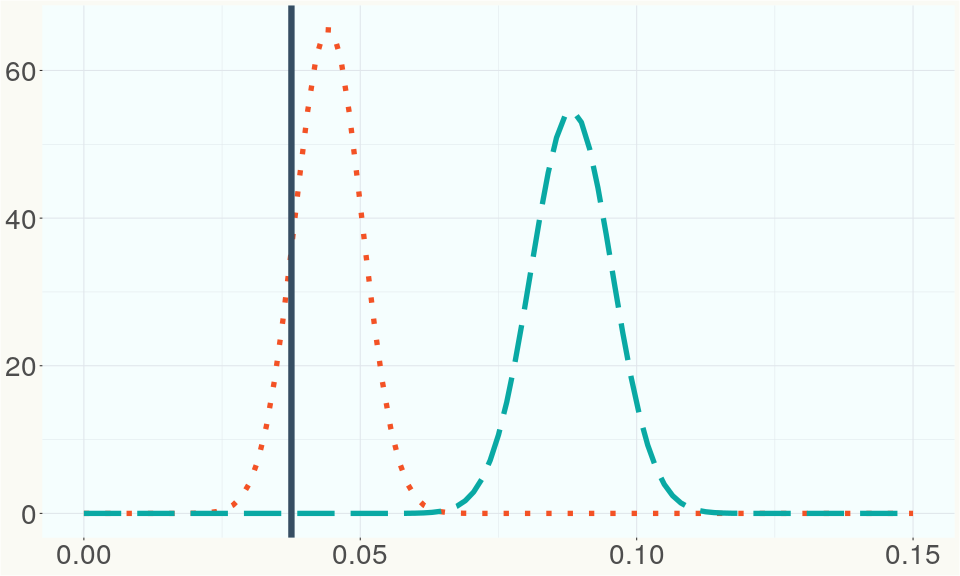
The bell curve in the heterozygosity visualization shows the distribution of heterozygosity levels for cannabis cultivars in the Kannapedia database. The green line shows where this particular strain fits within the distribution. Heterozygosity is associated with heterosis (aka hybrid vigor) but also leads to the production of more variable offspring. When plants have two genetically different parents, heterozygosity levels will be higher than if it has been inbred or backcrossed repeatedly.
The ratio of reads mapped to Y-contigs to reads mapped to the whole Cannabis genome (Y-ratios) has been demonstrated to be strongly correlated with plant sex typing. This plot shows the distribution of Y-ratios for all samples in our database which were sequenced with the same method (panel or WGS) as this sample and where this sample falls in the distribution.
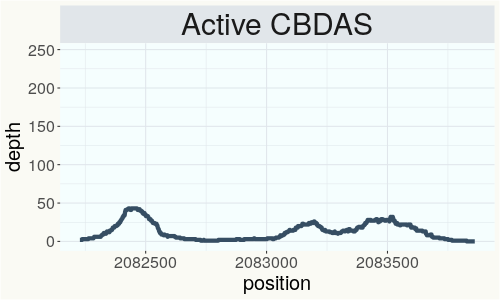
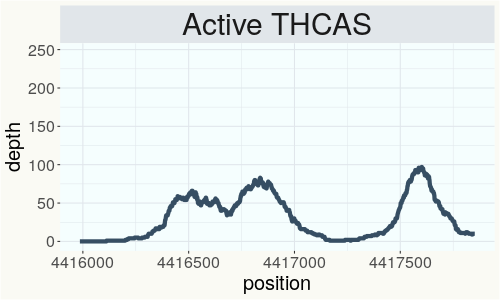
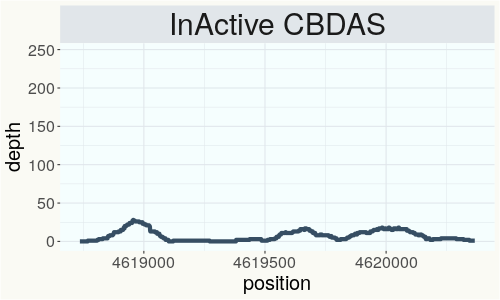
This chart represents the Illumina sequence coverage over the Bt/Bd allele. These are the three regions in the cannabis genome that impact THCA, CBDA, CBGA production. Coverage over the Active CBDAS gene is highly correlated with Type II and Type III plants as described by Etienne de Meijer. Coverage over the THCA gene is highly correlated with Type I and Type II plants but is anti-correlated with Type III plants. Type I plants require coverage over the inactive CBDA loci and no coverage over the Active CBDA gene. Lack of coverage over the Active CBDA and Active THCA allele are presumed to be Type IV plants (CBGA dominant). While deletions of entire THCAS and CBDAS genes are the most common Bt:Bd alleles observed, it is possible to have plants with these genes where functional expression of the enzyme is disrupted by deactivating point mutations (Kojoma et al. 2006).
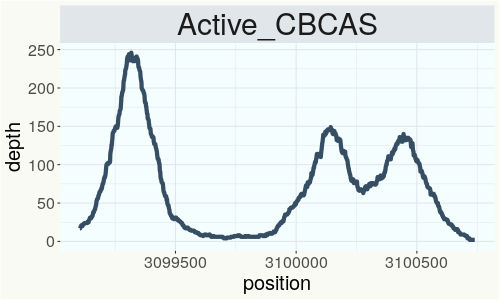
This chart represents the Illumina sequence coverage over the CBCA synthase gene.
Variants (THCAS, CBDAS, and CBCAS)
Variants (Select Genes of Interest)
| PKSG-2a | c.67T>A | p.Phe23Ile | missense variant | moderate | contig700 | 1945567 | A/T | |
| PKSG-2a | c.31A>T | p.Thr11Ser | missense variant | moderate | contig700 | 1945603 | T/A | |
| PKSG-2b | c.1152T>A | p.Asn384Lys | missense variant | moderate | contig700 | 1950486 | A/T | |
| PKSG-2b | c.1132C>G | p.Leu378Val | missense variant | moderate | contig700 | 1950506 | G/C |
|
| PKSG-2b | c.1117A>G | p.Ile373Val | missense variant | moderate | contig700 | 1950521 | T/C | |
| PKSG-2b | c.774G>A | p.Met258Ile | missense variant | moderate | contig700 | 1950864 | C/T | |
| PKSG-2b | c.31A>T | p.Thr11Ser | missense variant | moderate | contig700 | 1951851 | T/A | |
| DXR-2 | c.431C>G | p.Ala144Gly | missense variant | moderate | contig380 | 287760 | G/C | |
| aPT4 | c.97T>C | p.Tyr33His | missense variant | moderate | contig121 | 2828753 | T/C |
|
| aPT4 | c.775delT | p.Tyr259fs | frameshift variant | high | contig121 | 2831380 | AT/A |
|
| aPT4 | c.1168T>C | p.Tyr390His | missense variant | moderate | contig121 | 2833503 | T/C |
|
| aPT1 | c.406A>G | p.Ile136Val | missense variant | moderate | contig121 | 2839605 | A/G | |
| aPT1 | c.629C>T | p.Thr210Ile | missense variant | moderate | contig121 | 2840237 | C/T | |
| HDS-2 |
c.82_93delGT |
p.Val28_Thr3 |
conservative inframe deletion | moderate | contig95 | 1989748 |
CGTAACCGGAAC |
|
| HDS-2 | c.127T>G | p.Ser43Ala | missense variant | moderate | contig95 | 1989794 | T/G |
|
Nearest genetic relatives (All Samples)
- 0.044 JL X NSPM1 14 (RSP11473)
- 0.056 JL Tent 2 (RSP11489)
- 0.057 JL Tent 3 (RSP11490)
- 0.066 JL Cross 28 (RSP11529)
- 0.073 JL X NSPM1 21 (RSP11474)
- 0.075 JL Cross 17 (RSP11518)
- 0.077 JL X NSPM1 7 (RSP11469)
- 0.079 JL Cross 21 (RSP11522)
- 0.101 JL x NSPM1 1 (RSP11478)
- 0.101 JL Cross 19 (RSP11520)
- 0.102 JL Cross 9 (RSP11510)
- 0.108 JL X NSPM1 30 (RSP11476)
- 0.110 JL x NSPM1 3 (RSP11481)
- 0.110 JL X NSPM1 33 (RSP11477)
- 0.111 JL Cross 26 (RSP11527)
- 0.112 JL x NSPM1 1 5 (RSP11479)
- 0.113 JL Cross 23 (RSP11524)
- 0.117 JL X NSPM1 22 (RSP11475)
- 0.117 JL Cross 2 (RSP11503)
- 0.123 JL X NSPM1 6 (RSP11468)
Most genetically distant strains (All Samples)
- 0.466 80E (RSP11213)
- 0.433 80E (RSP11211)
- 0.433 80E (RSP11212)
- 0.429 CS (RSP11208)
- 0.425 Northern Lights (RSP11501)
- 0.415 Cbot-2019-005 (RSP11133)
- 0.409 Arcata Trainwreck (RSP11176)
- 0.409 White Label 1 (RSP11336)
- 0.408 IUP3 (SRR14708256)
- 0.408 Carmagnola (RSP11202)
- 0.408 R1in136 (SRR14708226)
- 0.406 RKM-2018-024 (RSP11116)
- 0.406 Tanao Sri -46- (RSP11486)
- 0.404 Carmagnola (RSP10980)
- 0.403 IUP2 (SRR14708257)
- 0.402 R1in136 (SRR14708237)
- 0.402 Feral (RSP11206)
- 0.401 Feral (RSP11205)
- 0.401 Carmagnola (RSP10977)
- 0.400 Carmagnola (RSP11037)
Nearest genetic relative in Phylos dataset
- Overlapping SNPs:
- 71
- Concordance:
- 48
Nearest genetic relative in Lynch dataset
- Overlapping SNPs:
- 6
- Concordance:
- 6
Blockchain Registration Information
- SHASUM Hash
-
4e2f80897f4a2cd930dd26f952881361 7276918f3e6f7828 08854776f979ca77
