JL_Tent_4
RSP 11491
Grower: Kevin Mckernan
General Information
- Accession Date
- May 21, 2020
- Reported Plant Sex
- Female
- Report Type
- StrainSEEK v2 3.2Mb
- DNA Extracted From
- Stem
The strain rarity visualization shows how distant the strain is from the other cultivars in the Kannapedia database. The y-axis represents genetic distance, getting farther as you go up. The width of the visualization at any position along the y-axis shows how many strains there are in the database at that genetic distance. So, a common strain will have a more bottom-heavy shape, while uncommon and rare cultivars will have a visualization that is generally shifted towards the top.
Chemical Information
Cannabinoid and terpenoid information provided by the grower.
Cannabinoids
No information provided.
Terpenoids
No information provided.
Genetic Information
- Plant Type
- Type II
File Downloads
The bell curve in the heterozygosity visualization shows the distribution of heterozygosity levels for cannabis cultivars in the Kannapedia database. The green line shows where this particular strain fits within the distribution. Heterozygosity is associated with heterosis (aka hybrid vigor) but also leads to the production of more variable offspring. When plants have two genetically different parents, heterozygosity levels will be higher than if it has been inbred or backcrossed repeatedly.
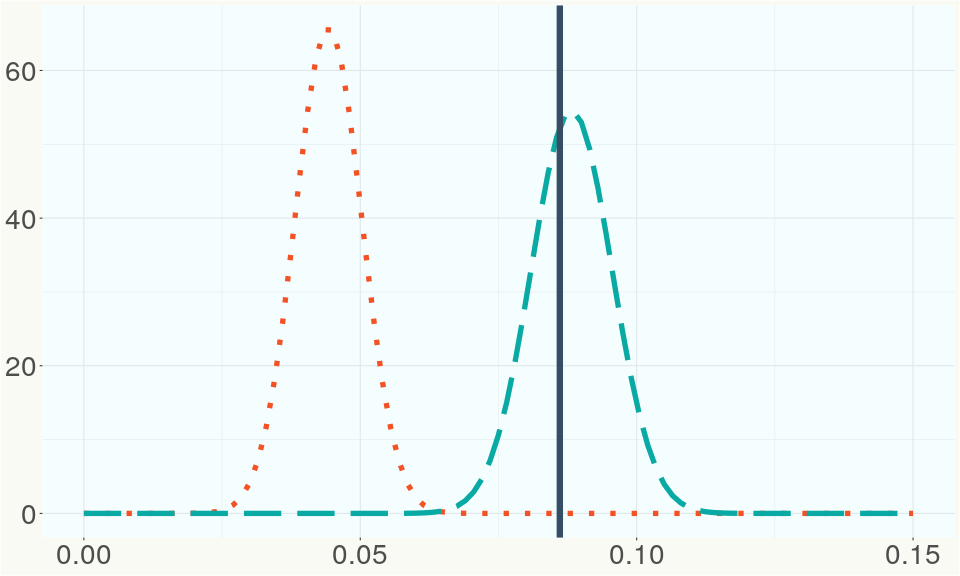
The ratio of reads mapped to Y-contigs to reads mapped to the whole Cannabis genome (Y-ratios) has been demonstrated to be strongly correlated with plant sex typing. This plot shows the distribution of Y-ratios for all samples in our database which were sequenced with the same method (panel or WGS) as this sample and where this sample falls in the distribution.
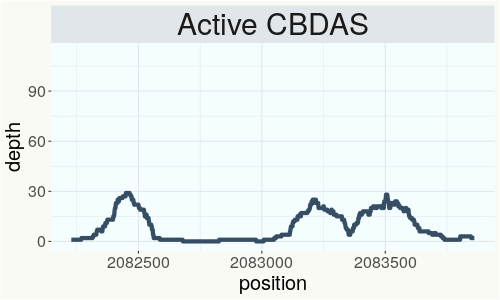
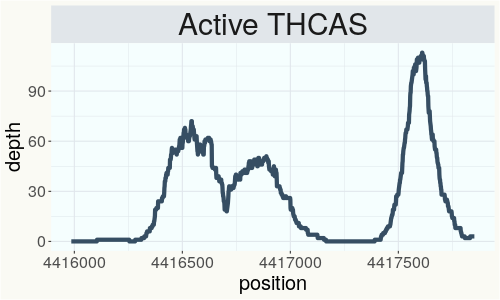
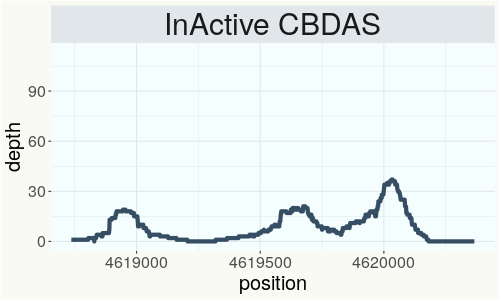
This chart represents the Illumina sequence coverage over the Bt/Bd allele. These are the three regions in the cannabis genome that impact THCA, CBDA, CBGA production. Coverage over the Active CBDAS gene is highly correlated with Type II and Type III plants as described by Etienne de Meijer. Coverage over the THCA gene is highly correlated with Type I and Type II plants but is anti-correlated with Type III plants. Type I plants require coverage over the inactive CBDA loci and no coverage over the Active CBDA gene. Lack of coverage over the Active CBDA and Active THCA allele are presumed to be Type IV plants (CBGA dominant). While deletions of entire THCAS and CBDAS genes are the most common Bt:Bd alleles observed, it is possible to have plants with these genes where functional expression of the enzyme is disrupted by deactivating point mutations (Kojoma et al. 2006).
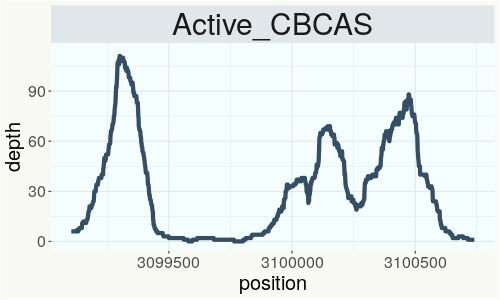
This chart represents the Illumina sequence coverage over the CBCA synthase gene.
Variants (THCAS, CBDAS, and CBCAS)
No variants to report
Variants (Select Genes of Interest)
| PKSG-2a | c.67T>A | p.Phe23Ile | missense variant | moderate | contig700 | 1945567 | A/T | |
| PKSG-2a | c.31A>T | p.Thr11Ser | missense variant | moderate | contig700 | 1945603 | T/A | |
| PKSG-2b | c.1152T>A | p.Asn384Lys | missense variant | moderate | contig700 | 1950486 | A/T | |
| PKSG-2b | c.1132C>G | p.Leu378Val | missense variant | moderate | contig700 | 1950506 | G/C |
|
| PKSG-2b | c.1117A>G | p.Ile373Val | missense variant | moderate | contig700 | 1950521 | T/C | |
| PKSG-2b | c.31A>T | p.Thr11Ser | missense variant | moderate | contig700 | 1951851 | T/A | |
| PKSG-4b |
c.535_545del |
p.Ile179fs | frameshift variant | high | contig700 | 2721127 |
CCCCACTCCAAT |
|
| PKSG-4b | c.523C>T | p.His175Tyr | missense variant | moderate | contig700 | 2721150 | G/A | |
| PKSG-4b | c.496A>G | p.Lys166Glu | missense variant | moderate | contig700 | 2721177 | T/C | |
| PKSG-4b | c.489delT | p.Phe163fs | frameshift variant | high | contig700 | 2721183 | CA/C | |
| PKSG-4b | c.485A>G | p.Lys162Arg | missense variant | moderate | contig700 | 2721188 | T/C | |
| PKSG-4b | c.431T>G | p.Val144Gly | missense variant | moderate | contig700 | 2721242 | A/C | |
| FAD2-2 | c.62C>T | p.Pro21Leu | missense variant | moderate | contig83 | 1803307 | G/A |
|
| aPT4 | c.1168T>C | p.Tyr390His | missense variant | moderate | contig121 | 2833503 | T/C |
|
| aPT1 |
c.95_97delGT |
p.Cys32del | disruptive inframe deletion | moderate | contig121 | 2835800 | ATGT/A | |
| aPT1 | c.406A>G | p.Ile136Val | missense variant | moderate | contig121 | 2839605 | A/G | |
| HDS-2 |
c.82_93delGT |
p.Val28_Thr3 |
conservative inframe deletion | moderate | contig95 | 1989748 |
CGTAACCGGAAC |
|
| HDS-2 | c.127T>G | p.Ser43Ala | missense variant | moderate | contig95 | 1989794 | T/G |
|
Nearest genetic relatives (All Samples)
- 0.055 JL x NSPM1 3 (RSP11481)
- 0.058 JL Cross 23 (RSP11524)
- 0.067 JL Tent 1 yellow stake (RSP11488)
- 0.078 JL X NSPM1 33 (RSP11477)
- 0.088 JL Cross 9 (RSP11510)
- 0.090 JL Cross 15 (RSP11516)
- 0.099 JL X NSPM1 6 (RSP11468)
- 0.100 JL X NSPM1 30 (RSP11476)
- 0.100 JL Tent 2 (RSP11489)
- 0.101 JL Cross 19 (RSP11520)
- 0.103 JL Cross 22 (RSP11523)
- 0.103 JL X NSPM1 7 (RSP11469)
- 0.113 JL X NSPM1 21 (RSP11474)
- 0.113 JL Tent 3 (RSP11490)
- 0.115 JL Cross 17 (RSP11518)
- 0.115 JL X NSPM1 14 (RSP11473)
- 0.124 JL Cross 2 (RSP11503)
- 0.125 JL x NSPM1 1 5 (RSP11479)
- 0.127 JL Cross 28 (RSP11529)
- 0.129 JL X NSPM1 5 (RSP11467)
Most genetically distant strains (All Samples)
- 0.473 80E (RSP11213)
- 0.470 Cbot-2019-005 (RSP11133)
- 0.464 80E (RSP11212)
- 0.460 CS (RSP11208)
- 0.458 Carmaleonte (RSP11207)
- 0.455 80E (RSP11211)
- 0.446 Northern Skunk (RSP11456)
- 0.438 Cherry Blossom (RSP11318)
- 0.437 Northern Lights (RSP11501)
- 0.431 Feral (RSP11205)
- 0.430 Cherry Blossom (RSP11274)
- 0.429 Cherry Blossom (RSP11333)
- 0.429 AVIDEKEL 2 0 (RSP11174)
- 0.428 BagSeed (RSP12627)
- 0.426 Unknown--Cherry Wine---001- (RSP11268)
- 0.424 CS Indica (RSP11658)
- 0.423 Cherry Blossom (RSP11323)
- 0.422 Cherry Blossom (RSP11311)
- 0.421 Arcata Trainwreck (RSP11176)
- 0.420 Carmagnola (RSP11202)
Nearest genetic relative in Phylos dataset
- Overlapping SNPs:
- 89
- Concordance:
- 53
Nearest genetic relative in Lynch dataset
- Overlapping SNPs:
- 4
- Concordance:
- 4
Blockchain Registration Information
- Transaction ID
-
8d57d499fc491793
1d0915bc3272ee8e e9b01270fd75dae3 a88ec9cbf72c28d6 - Stamping Certificate
- Download PDF (39.9 KB)
- SHASUM Hash
-
2712529d6bfe5007add405ca1493669e 753c052f97ac61fb 647f43dd55a654de
