USO31
RSP 10233
Grower: CSU
General Information
- Sample Name
- USO31-3
- Accession Date
- May 12, 2016
- Reported Plant Sex
- Female
- Report Type
- StrainSEEK v2 3.2Mb
- DNA Extracted From
- Leaf
The strain rarity visualization shows how distant the strain is from the other cultivars in the Kannapedia database. The y-axis represents genetic distance, getting farther as you go up. The width of the visualization at any position along the y-axis shows how many strains there are in the database at that genetic distance. So, a common strain will have a more bottom-heavy shape, while uncommon and rare cultivars will have a visualization that is generally shifted towards the top.
Chemical Information
Cannabinoid and terpenoid information provided by the grower.
Cannabinoids
No information provided.
Terpenoids
No information provided.
Genetic Information
- Plant Type
- Type III
File Downloads
The bell curve in the heterozygosity visualization shows the distribution of heterozygosity levels for cannabis cultivars in the Kannapedia database. The green line shows where this particular strain fits within the distribution. Heterozygosity is associated with heterosis (aka hybrid vigor) but also leads to the production of more variable offspring. When plants have two genetically different parents, heterozygosity levels will be higher than if it has been inbred or backcrossed repeatedly.
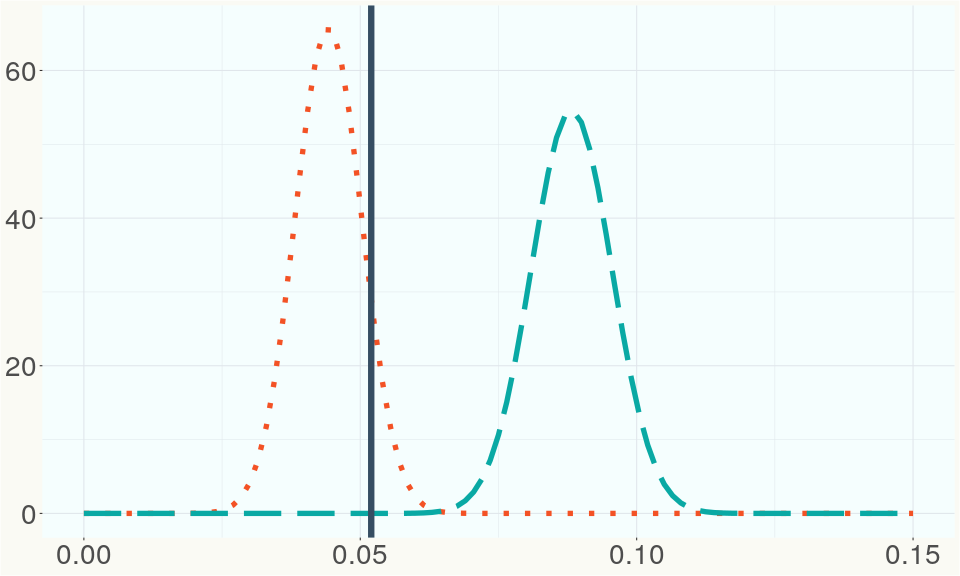
The ratio of reads mapped to Y-contigs to reads mapped to the whole Cannabis genome (Y-ratios) has been demonstrated to be strongly correlated with plant sex typing. This plot shows the distribution of Y-ratios for all samples in our database which were sequenced with the same method (panel or WGS) as this sample and where this sample falls in the distribution.
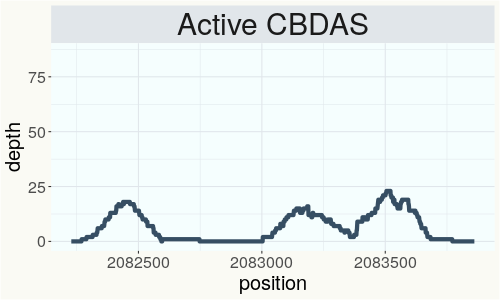
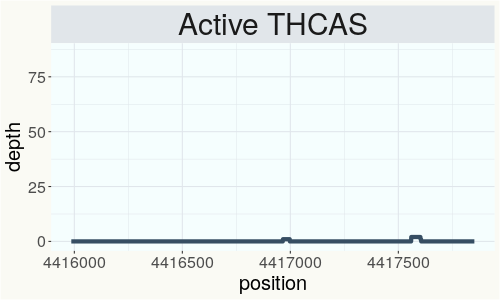
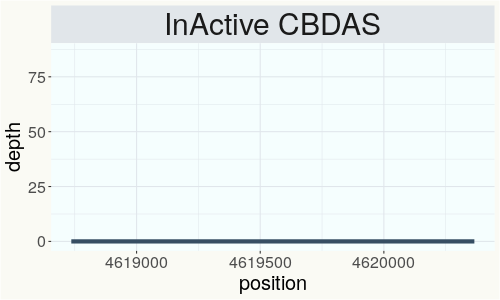
This chart represents the Illumina sequence coverage over the Bt/Bd allele. These are the three regions in the cannabis genome that impact THCA, CBDA, CBGA production. Coverage over the Active CBDAS gene is highly correlated with Type II and Type III plants as described by Etienne de Meijer. Coverage over the THCA gene is highly correlated with Type I and Type II plants but is anti-correlated with Type III plants. Type I plants require coverage over the inactive CBDA loci and no coverage over the Active CBDA gene. Lack of coverage over the Active CBDA and Active THCA allele are presumed to be Type IV plants (CBGA dominant). While deletions of entire THCAS and CBDAS genes are the most common Bt:Bd alleles observed, it is possible to have plants with these genes where functional expression of the enzyme is disrupted by deactivating point mutations (Kojoma et al. 2006).
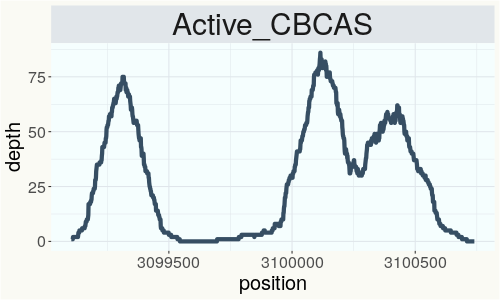
This chart represents the Illumina sequence coverage over the CBCA synthase gene.
Variants (THCAS, CBDAS, and CBCAS)
Variants (Select Genes of Interest)
| PKSG-2a | c.67T>A | p.Phe23Ile | missense variant | moderate | contig700 | 1945567 | A/T | |
| PKSG-2a | c.31A>T | p.Thr11Ser | missense variant | moderate | contig700 | 1945603 | T/A | |
| PKSG-2b | c.1152T>A | p.Asn384Lys | missense variant | moderate | contig700 | 1950486 | A/T | |
| PKSG-2b | c.948T>G | p.Asp316Glu | missense variant | moderate | contig700 | 1950690 | A/C |
|
| PKSG-2b | c.945T>G | p.Ser315Arg | missense variant | moderate | contig700 | 1950693 | A/C |
|
| PKSG-2b | c.944G>A | p.Ser315Asn | missense variant | moderate | contig700 | 1950694 | C/T |
|
| PKSG-2b | c.934C>G | p.His312Asp | missense variant | moderate | contig700 | 1950704 | G/C |
|
| PKSG-2b | c.31A>T | p.Thr11Ser | missense variant | moderate | contig700 | 1951851 | T/A | |
| PKSG-4b | c.496A>G | p.Lys166Glu | missense variant | moderate | contig700 | 2721177 | T/C | |
| PKSG-4b | c.489delT | p.Phe163fs | frameshift variant | high | contig700 | 2721183 | CA/C | |
| PKSG-4b | c.485A>G | p.Lys162Arg | missense variant | moderate | contig700 | 2721188 | T/C | |
| PKSG-4b | c.431T>G | p.Val144Gly | missense variant | moderate | contig700 | 2721242 | A/C | |
| PKSG-4b | c.419A>G | p.Asp140Gly | missense variant | moderate | contig700 | 2721254 | T/C | |
| aPT4 | c.470T>C | p.Leu157Ser | missense variant | moderate | contig121 | 2830665 | T/C |
|
| aPT4 | c.517A>T | p.Ile173Leu | missense variant & splice region variant | moderate | contig121 | 2830795 | A/T |
|
| aPT4 | c.1168T>C | p.Tyr390His | missense variant | moderate | contig121 | 2833503 | T/C |
|
| aPT1 |
c.95_97delGT |
p.Cys32del | disruptive inframe deletion | moderate | contig121 | 2835800 | ATGT/A | |
| aPT1 | c.406A>G | p.Ile136Val | missense variant | moderate | contig121 | 2839605 | A/G | |
| aPT1 | c.629C>T | p.Thr210Ile | missense variant | moderate | contig121 | 2840237 | C/T | |
| aPT1 | c.715G>C | p.Ala239Pro | missense variant | moderate | contig121 | 2841350 | G/C |
|
| aPT1 | c.727G>T | p.Glu243* | stop gained | high | contig121 | 2841362 | G/T | |
| aPT1 | c.958G>A | p.Gly320Ser | missense variant | moderate | contig121 | 2842731 | G/A |
|
| HDS-2 |
c.82_93delGT |
p.Val28_Thr3 |
conservative inframe deletion | moderate | contig95 | 1989748 |
CGTAACCGGAAC |
|
| HDS-2 | c.127T>G | p.Ser43Ala | missense variant | moderate | contig95 | 1989794 | T/G |
|
Nearest genetic relatives (All Samples)
- 0.156 Santhica 27 (RSP10665)
- 0.165 USO 31 (RSP10983)
- 0.167 Santhica27 (RSP10056)
- 0.170 Lovrin (RSP10658)
- 0.171 R1in136 (SRR14708237)
- 0.172 R1in136 (SRR14708226)
- 0.172 USO 31 (RSP10981)
- 0.176 Juso14 (SRR14708259)
- 0.179 Tygra (RSP10667)
- 0.182 Beniko (SRR14708275)
- 0.184 VIR 223 - Bernburgskaya Odnodomnaya - bm (SRR14708217)
- 0.185 Bialobrzeskie (SRR14708244)
- 0.188 Fedora 17 (RSP10661)
- 0.188 Futura 75 (RSP10664)
- 0.188 VIR 507 - Krasnodarsky 10 FB (SRR14708229)
- 0.189 Santhica27 (RSP11047)
- 0.190 Santhica27 (RSP11046)
- 0.193 Monoica (RSP10241)
- 0.193 Fedora 17 (SRR14708222)
- 0.195 R1in136 (SRR14708227)
Most genetically distant strains (All Samples)
- 0.463 Cherry Blossom (RSP11323)
- 0.457 Cherry Blossom (RSP11312)
- 0.448 Cherry Blossom (RSP11301)
- 0.443 Cherry Blossom (RSP11311)
- 0.442 Cherry Blossom (RSP11331)
- 0.441 Cherry Blossom (RSP11318)
- 0.437 Cherry Blossom (RSP11298)
- 0.436 Chematonic -Cannatonic x Chemdawg- (RSP11394)
- 0.434 Cherry Blossom (RSP11300)
- 0.432 Chem 91 (RSP11185)
- 0.428 JL Cross 14 (RSP11515)
- 0.426 Cherry Blossom (RSP11322)
- 0.425 Cherry Blossom (RSP11308)
- 0.424 Cherry Blossom (RSP11334)
- 0.423 Cherry Blossom (RSP11328)
- 0.422 Cherry Blossom (RSP11335)
- 0.420 JL x NSPM1 4 (RSP11482)
- 0.418 Cherry Blossom (RSP11327)
- 0.417 BagSeed (RSP12627)
- 0.417 Cherry Blossom (RSP11299)
Nearest genetic relative in Phylos dataset
- Overlapping SNPs:
- 123
- Concordance:
- 88
Nearest genetic relative in Lynch dataset
- Overlapping SNPs:
- 11
- Concordance:
- 10
Blockchain Registration Information
- Transaction ID
-
3a666144f2508230
dd6174634d65a30b 35988ca82942d9c0 401a4b90b09289eb - Stamping Certificate
- Download PDF (864.3 KB)
- SHASUM Hash
-
0cd30ec577accaf5c07e0c2141ab2ee0 f252ef8c4e97e75b b9205e0417de9c54
