PCL2
SRR 14708245
General Information
- Accession Date
- May 31, 2021
- Reported Plant Sex
- not reported
- Report Type
- Whole-Genome Sequencing
The strain rarity visualization shows how distant the strain is from the other cultivars in the Kannapedia database. The y-axis represents genetic distance, getting farther as you go up. The width of the visualization at any position along the y-axis shows how many strains there are in the database at that genetic distance. So, a common strain will have a more bottom-heavy shape, while uncommon and rare cultivars will have a visualization that is generally shifted towards the top.
Chemical Information
Cannabinoid and terpenoid information provided by the grower.
Cannabinoids
No information provided.
Terpenoids
No information provided.
Genetic Information
- Plant Type
- Type III
File Downloads
The bell curve in the heterozygosity visualization shows the distribution of heterozygosity levels for cannabis cultivars in the Kannapedia database. The green line shows where this particular strain fits within the distribution. Heterozygosity is associated with heterosis (aka hybrid vigor) but also leads to the production of more variable offspring. When plants have two genetically different parents, heterozygosity levels will be higher than if it has been inbred or backcrossed repeatedly.
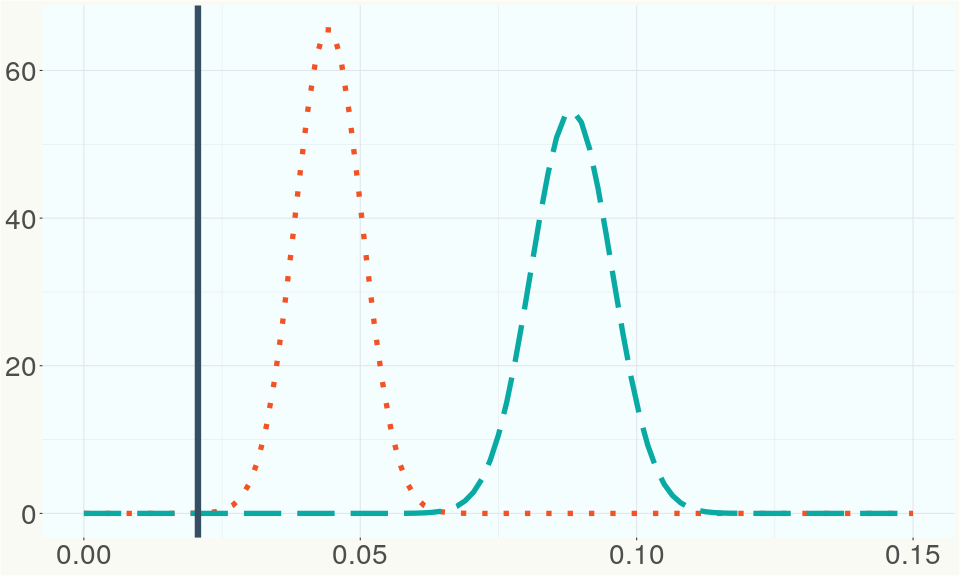
The ratio of reads mapped to Y-contigs to reads mapped to the whole Cannabis genome (Y-ratios) has been demonstrated to be strongly correlated with plant sex typing. This plot shows the distribution of Y-ratios for all samples in our database which were sequenced with the same method (panel or WGS) as this sample and where this sample falls in the distribution.
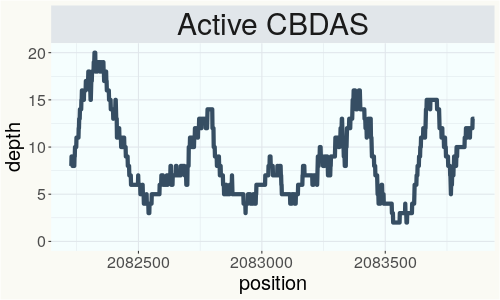
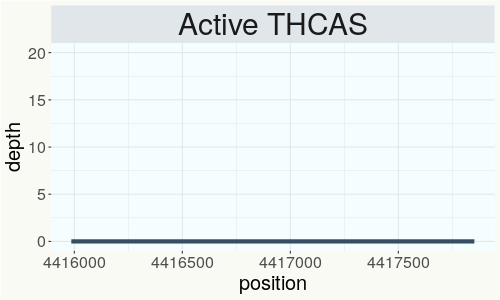
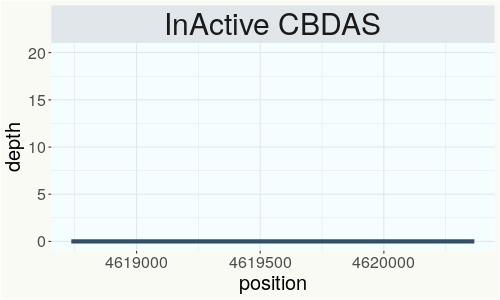
This chart represents the Illumina sequence coverage over the Bt/Bd allele. These are the three regions in the cannabis genome that impact THCA, CBDA, CBGA production. Coverage over the Active CBDAS gene is highly correlated with Type II and Type III plants as described by Etienne de Meijer. Coverage over the THCA gene is highly correlated with Type I and Type II plants but is anti-correlated with Type III plants. Type I plants require coverage over the inactive CBDA loci and no coverage over the Active CBDA gene. Lack of coverage over the Active CBDA and Active THCA allele are presumed to be Type IV plants (CBGA dominant). While deletions of entire THCAS and CBDAS genes are the most common Bt:Bd alleles observed, it is possible to have plants with these genes where functional expression of the enzyme is disrupted by deactivating point mutations (Kojoma et al. 2006).
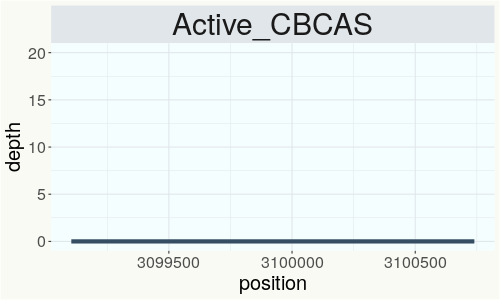
This chart represents the Illumina sequence coverage over the CBCA synthase gene.
Variants (THCAS, CBDAS, and CBCAS)
Variants (Select Genes of Interest)
| GPPs1 |
c.845_848del |
p.Glu282fs | frameshift variant | high | contig676 | 169629 | TGAAA/T |
|
| PHL-2 | c.1837G>A | p.Glu613Lys | missense variant | moderate | contig2621 | 341115 | G/A |
|
| PHL-2 | c.2564T>A | p.Phe855Tyr | missense variant | moderate | contig2621 | 342607 | T/A | |
| PKSG-2a | c.67T>A | p.Phe23Ile | missense variant | moderate | contig700 | 1945567 | A/T | |
| DXR-2 | c.1319T>C | p.Ile440Thr | missense variant | moderate | contig380 | 285250 | A/G |
|
| ELF4 | c.144T>A | p.Asp48Glu | missense variant | moderate | contig869 | 622426 | A/T |
|
| ELF3 | c.574A>G | p.Asn192Asp | missense variant | moderate | contig97 | 242280 | A/G | |
| OAC-1 | c.260C>G | p.Ser87Cys | missense variant | moderate | contig931 | 118104 | G/C |
|
| OAC-1 | c.52G>T | p.Ala18Ser | missense variant | moderate | contig931 | 118412 | C/A |
|
| AAE1-2 | c.1006A>G | p.Lys336Glu | missense variant | moderate | contig81 | 209968 | A/G |
|
| AAE1-2 | c.1415G>A | p.Ser472Asn | missense variant | moderate | contig81 | 210377 | G/A |
|
| AAE1-2 | c.1417A>G | p.Thr473Ala | missense variant | moderate | contig81 | 210379 | A/G |
|
| AAE1-2 | c.1434G>T | p.Glu478Asp | missense variant | moderate | contig81 | 210396 | G/T |
|
| PKSG-2b | c.1152T>A | p.Asn384Lys | missense variant | moderate | contig700 | 1950486 | A/T | |
| TFL1 | c.368G>T | p.Arg123Met | missense variant | moderate | contig1636 | 520549 | C/A |
|
| TFL1 | c.358G>A | p.Gly120Arg | missense variant | moderate | contig1636 | 520559 | C/T |
|
| TFL1 | c.304G>A | p.Asp102Asn | missense variant & splice region variant | moderate | contig1636 | 520613 | C/T |
|
| TFL1 | c.302-1G>A | splice acceptor variant & intron variant | high | contig1636 | 520616 | C/T | ||
| HDS-1 |
c.-108+1_-10 |
splice donor variant & intron variant | high | contig1891 | 889975 | A/AC |
|
|
| EMF1-1 |
c.627_629dup |
p.Val210dup | disruptive inframe insertion | moderate | contig883 | 270231 | A/ATGT |
|
| FT | c.240C>G | p.Asn80Lys | missense variant | moderate | contig1561 | 3124664 | C/G |
|
| aPT4 | c.16G>A | p.Val6Ile | missense variant | moderate | contig121 | 2828672 | G/A |
|
| aPT4 | c.97T>C | p.Tyr33His | missense variant | moderate | contig121 | 2828753 | T/C |
|
| aPT4 |
c.235_236del |
p.Val79fs | frameshift variant | high | contig121 | 2829030 | ATG/A |
|
| aPT4 | c.238delT | p.Ser80fs | frameshift variant | high | contig121 | 2829034 | AT/A |
|
| aPT4 | c.302A>G | p.Asn101Ser | missense variant | moderate | contig121 | 2829099 | A/G |
|
| FLD | c.2810+2T>C | splice donor variant & intron variant | high | contig1450 | 2044250 | A/G |
|
|
| FLD | c.2746A>G | p.Asn916Asp | missense variant | moderate | contig1450 | 2044531 | T/C |
|
| AAE1-3 | c.722G>A | p.Arg241Lys | missense variant | moderate | contig976 | 1083132 | C/T |
|
| AAE1-3 | c.659G>A | p.Arg220Gln | missense variant | moderate | contig976 | 1083195 | C/T |
|
| AAE1-3 | c.260T>C | p.Val87Ala | missense variant | moderate | contig976 | 1083765 | A/G |
|
Nearest genetic relatives (All Samples)
- 0.166 PCL1 (SRR14708246)
- 0.251 PID2 (SRR14708247)
- 0.262 KYRG-151 (RSP11052)
- 0.264 IBR1 (SRR14708251)
- 0.265 IUL1 (SRR14708254)
- 0.266 YNN (SRR14708199)
- 0.267 IMA (SRR14708203)
- 0.268 IBR3 (SRR14708249)
- 0.268 IBR2 (SRR14708250)
- 0.268 Jiangji (RSP10653)
- 0.269 PID1 (SRR14708248)
- 0.270 Kyrgyz Gold (RSP11054)
- 0.270 Carmagnola (RSP10982)
- 0.271 R3 (RSP11616)
- 0.271 Tak-HN (RSP11618)
- 0.272 IBE (SRR14708228)
- 0.273 Tiger Tail -78- (RSP11619)
- 0.273 R2 (RSP11615)
- 0.274 IUL2 (SRR14708253)
- 0.274 IUP1 (SRR14708258)
Most genetically distant strains (All Samples)
- 0.465 Cherry Blossom (RSP11318)
- 0.449 Cherry Blossom (RSP11301)
- 0.440 Cherry Blossom (RSP11323)
- 0.438 Cherry Blossom (RSP11300)
- 0.433 Unknown--Cherry Wine---001- (RSP11268)
- 0.431 Cherry Blossom (RSP11331)
- 0.429 Chem 91 (RSP11185)
- 0.429 Cherry Blossom (RSP11311)
- 0.429 CHEM4 (RSP12090)
- 0.427 Queen Dream (RSP11278)
- 0.426 Queen Dream CBG (RSP11287)
- 0.426 GG4 (RSP11978)
- 0.424 QLE1 (RSP11451)
- 0.424 Cherry Blossom (RSP11328)
- 0.421 Cherry Blossom (RSP11302)
- 0.421 Cherry Blossom (RSP11312)
- 0.421 New York City Deisel (RSP11225)
- 0.421 JL x NSPM1 4 (RSP11482)
- 0.420 Cherry Blossom (RSP11333)
- 0.419 Cherry Blossom (RSP11334)
Nearest genetic relative in Phylos dataset
- Overlapping SNPs:
- 14
- Concordance:
- 12
Nearest genetic relative in Lynch dataset
- Overlapping SNPs:
- 3
- Concordance:
- 3
